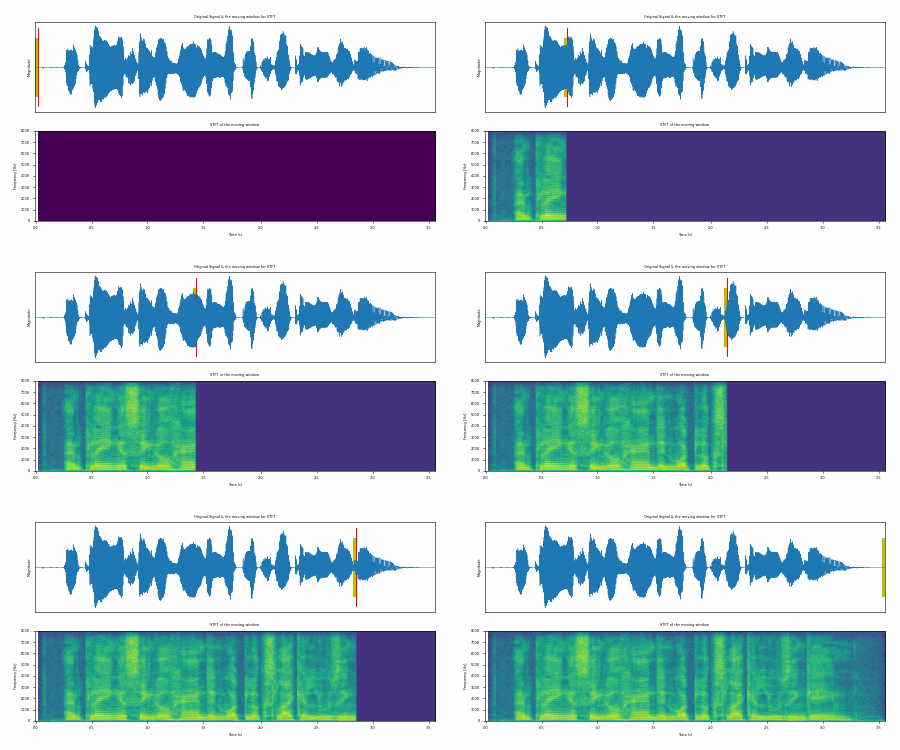
I am trying to implement a real time spectrogram and I am not sure that I am implementing it the right way. First I decided to use Matlab, I was taking a short recording of lets say 0.1 seconds and then perform the FFT on that array of numbers which basically consists of the amplitude of lets say a 11025 sampling rate in that 0.1 seconds. I was then plotting the result of the FFT after computing the magnitude. After this process, I would then record another 0.1 seconds and so on. This was being done in an infinite loop in order to try to achieve a real time result. I know that this is not a spectrogram is just a different representation of this information. The problem with this is that I am not getting a very good results from this calculation. For example I was giving a certain tone using a frequency tone generator, and I was seeing a peak at just some instances which shows that somewhere the algorithm is failing. I do not have to use MATLAB, I could also use other programming languages such as Java so I prefer if I do not utilize a ready made function such as 'spectrogram' which is only present in MATLAB.
So can someone tell me on how a real time FFT of audio should be performed please? So how real time spectrum analyzer achieve that quality and they are real time so if they are taking a short sample of time it must be really short and still manage to get a good representation out of it.

