5
$\begingroup$

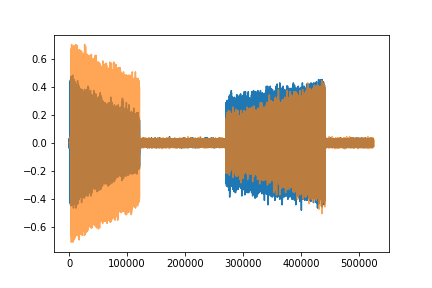
I have two radios sampling simultaneously, and I am trying to time-align their two signals (they will always start sampling at slightly different times with random delays due to hardware differences). I have a circuit that automatically switches between the antennas and nothing at a set interval, and I'm trying to use the transitions between signal and silence to determine how to time-align the two signals. I tried using cross correlation to find the shift between the two signals, but it's not getting the correct alignment (it's very off). I suspected it was due to the signals being too noisy, so I smoothed them both and tried to make their amplitudes similar, but it still didn't get the right alignment.

Here's a screenshot of an example of the two signals. The image is zoomed in to the region where the circuit switches the radios from nothing to the antennas, and I would like to align the two signals such that these transitions match up.

Two signals

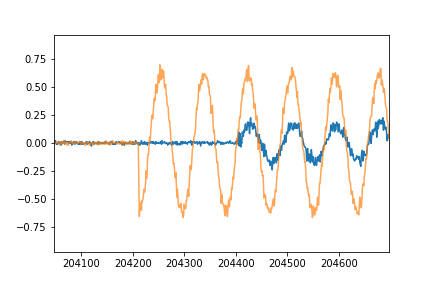
EDIT: Here are text files of two more signals that I'm trying to align: s0.txt s1.txt. When they're aligned, they look like this:

enter image description here

(note that these are not the same signals in the previous picture). I found the optimal delay to be 1069 for the first signal. I used other methods to find the delay (described in a comment below), but I would like to reproduce this result using cross correlation as I believe it will prove to be more reliable / precise.

$\endgroup$
8
  • $\begingroup$ since the transition of the orange signal appears to happen at a phase of 180° (assuming cosine as reference) and the transition of the blue signal happens at a phase of -90°, how do you want these two signals aligned? do you want the sinusoid phases aligned? or do you want the moment when things are turned on aligned? $\endgroup$ Commented Jul 9, 2018 at 18:42
  • $\begingroup$ I want them to be aligned in time (i.e. when they both turn on at the same time), not necessarily phase-aligned. $\endgroup$
    – jstein123
    Commented Jul 9, 2018 at 21:10
  • $\begingroup$ so you're trying to align their envelopes, right? $\endgroup$ Commented Jul 9, 2018 at 23:52
  • $\begingroup$ Yes, that's correct $\endgroup$
    – jstein123
    Commented Jul 10, 2018 at 12:38
  • $\begingroup$ then your cross-correlation operation should apply only to the envelopes. do you know how to do a rapid-rise (and slow decay) envelope? $\endgroup$ Commented Jul 10, 2018 at 19:08

2 Answers 2

0
$\begingroup$

If the above is a good representation you should just try to infer when there is energy in the signal to align them.
As it seems they start with nothing (Zero value).
Then all needed is just to find where "Something" happens. This could be easily done with high resolution (Few samples).

Regarding Cross Correlation, try to normalize both signal to have the same Maximum Value (Normalize both to have amplitude of 1).

In the case above you'll be able to say where the alignment point is.
Pay attention that if the whole signal is harmonic then the cross correlation is harmonic as well.

$\endgroup$
5
  • $\begingroup$ Thanks! I'm taking the rolling max of the magnitudes of the signal with windows of 1000, then I'm setting all the values under a threshold to a very low number, then I'm taking the gradient of that to find the starts and ends of the signal regions. I'm able to get a near-perfect alignment for most of them with this method. However, it bugs me a bit that I'm still not able to get cross correlation working. I normalized both signals by dividing them by their max, but the cross correlation still has no local max at the correct alignment. Thanks for your help! $\endgroup$
    – jstein123
    Commented Jul 9, 2018 at 19:56
  • $\begingroup$ If you post a link to the 2 signals we can try demonstrate something. $\endgroup$
    – Royi
    Commented Jul 9, 2018 at 20:31
  • $\begingroup$ Just edited the post to include links to 2 signals (I picked tricky ones). They were each recorded at almost the exact same time (each from a different radio), but there is a slight delay. Let me know if you're able to get cross correlation working, thanks! $\endgroup$
    – jstein123
    Commented Jul 9, 2018 at 21:23
  • $\begingroup$ "I'm taking the rolling max of the magnitudes of the signal with windows of 1000..." @jstein123, that is (also) an envelope. $\endgroup$ Commented Jul 12, 2018 at 1:31
  • $\begingroup$ Oh ok that makes sense! Do you know of any envelope finding algorithms that work very well on very noisy high resolution radio samples? Nothing I tried (hilbert transforms, etc) worked well at all. Even the rolling max doesn't work so great when the amplitude of the silence region isn't so much smaller than the amplitude of the noise region. Thanks! $\endgroup$
    – jstein123
    Commented Jul 13, 2018 at 12:46
0
$\begingroup$

Instead of the signal you could concentrate on the silence. Find the time when the absolute maximum value exceeds a set threshold to conclude that silence has ended.

$\endgroup$

Your Answer

By clicking “Post Your Answer”, you agree to our terms of service and acknowledge you have read our privacy policy.

Not the answer you're looking for? Browse other questions tagged or ask your own question.