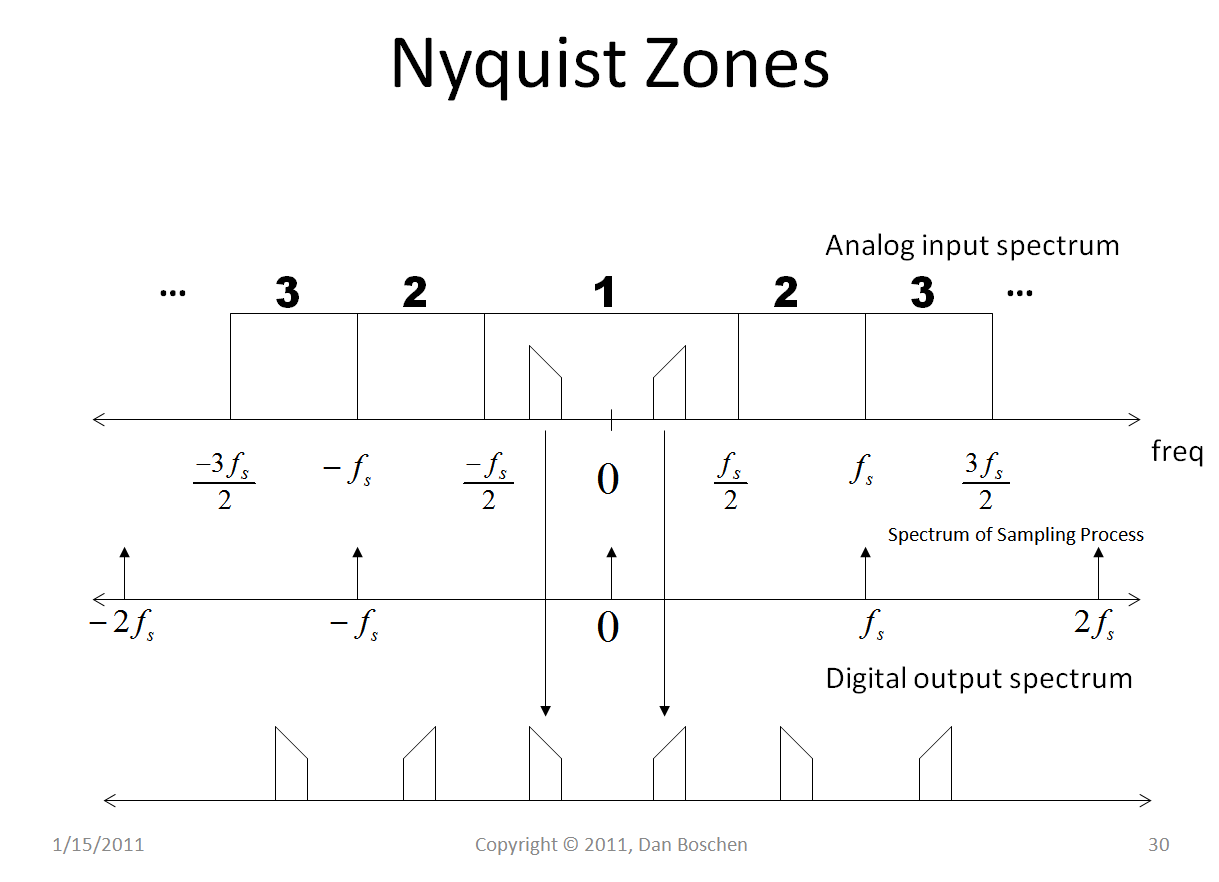
As far as the digital signal is concerned, the signal only exists uniquely in one Nyquist interval (which is $-f_s/2$ to $+f_s/2$ where $f_s$ is the sampling rate. Every other interval, such as in your range of interest that is well above the sampling rate, is a replica of the primary interval. Given that, note that the range from $f_s/2$ to $f_s$ is the same as $-f_s/2$ to $0$, so we can also describe the primary Nyquist interval as being from $0$ to $f_s$ (and Matlab's fftshift command converts a frequency axis from $0$ to $f_s$ to $-f_s/2$ to $+f_s/2$ according to this relationship). The following picture helps illustrate this:

This is formed because sampling is multiplying the time domain signal by an impulse train. An impulse train in time is an impulse train in frequency (as represented by the second row in the figure above). Multiplying in time is convolving in frequency, so the result is to convolve our analog spectrum with the spectrum of the sampling process (an impulse train) resulting in the replicas of the spectrum in the Digital Output Spectrum as shown. Since digitally every higher frequency is an exact replica of what is given from $-f_s/2$ to $+f_s/2$, we need only concern ourselves with the frequency over that range, which is the unique freqency span of a digital signal. However what I refer to as the "unwrapped view" of the digital signal has helped give me a much more intuitive insight into many multirate signal processing challenges, as well as undersampling (or bandpass sampling) as discussed here. The "unwrapped view" is done by extending the digital frequency axis from $-\infty$ to $+\infty$ while maintaining mathematical equivalence, which means replicating the same signal in each unique span of $n[0:f_s]$ where n is an integer extending to $-\infty$ to $+\infty$ as I have done in the figures here for the "Digital Output Spectrum".
That said, you would need to map the signal of interest to the primary interval and then design the filter in that space.
Further if your signal is real, the positive and negative frequencies would be complex symmetric (as diagrammed also in my figure), in which case we can just concern ourselves with the signal from $0$ to $f_s/2$. I suspect but have not confirmed the range in the python tool you referenced, given as 0 to 1 refers to DC to $f_s/2$ specifically.
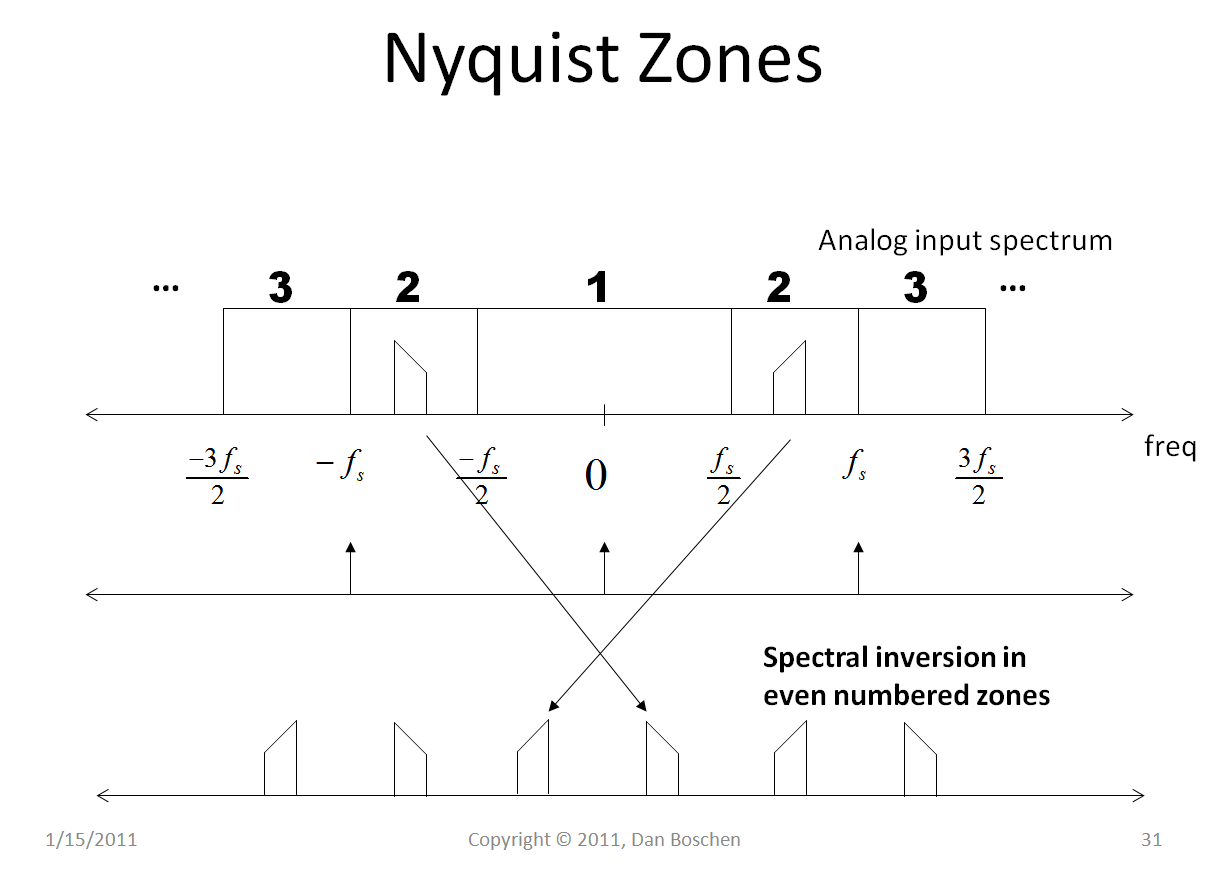
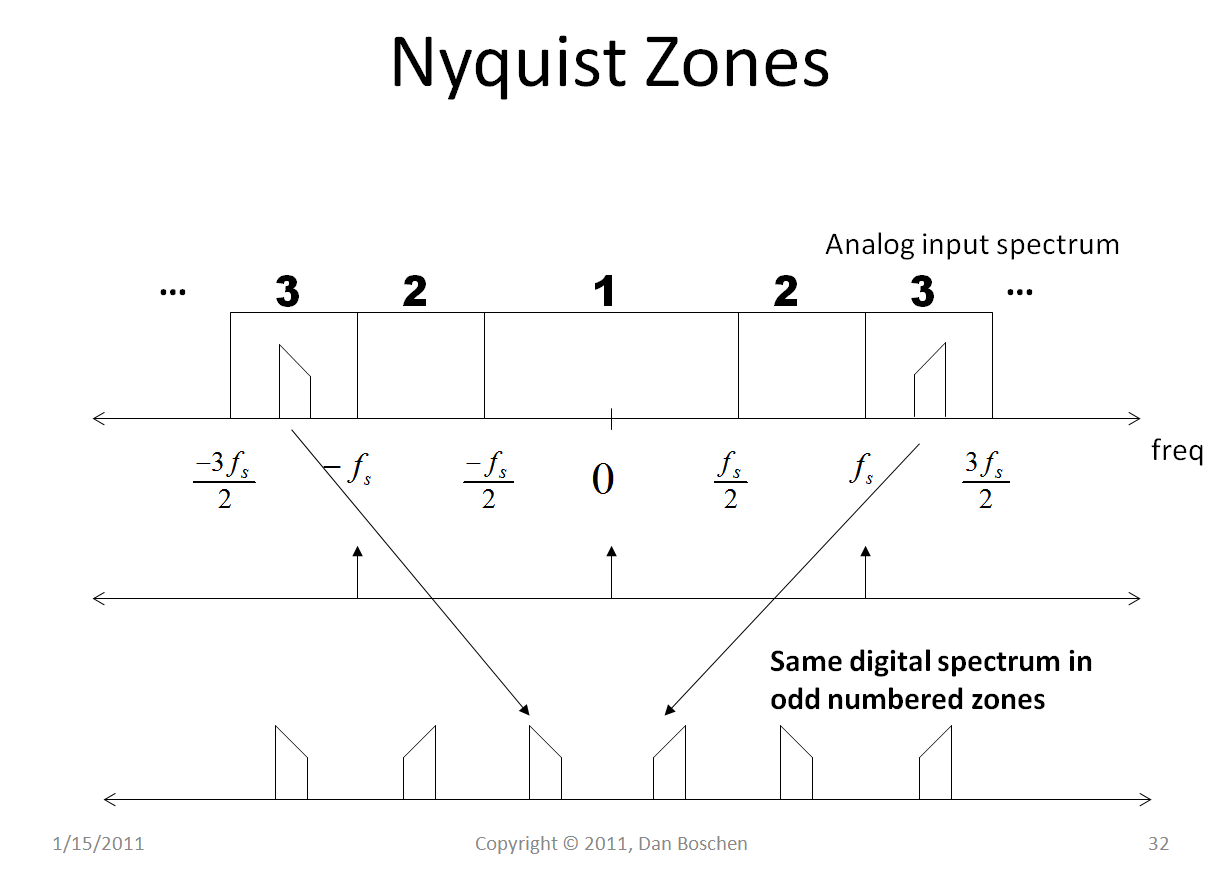
As you suggest, we can do bandpass sampling as long as the A/D Converter has an analog input bandwidth that supports this, and I won't get into the detail of it here except to say that the jitter requirements on your sampling clock are more stringent with bandpass sampling. This implies you have an appropriate bandpass filter (refered to as the anti-alias filter) in your analog system prior to your A/D Converter, as the A/D Converter will downconvert every signal in every Nyquist zone if unfiltered energy exists (and within the analog bandwidth of the A/D Converter, which effectively becomes part of the anti-alias filter). This bandpass filtering operation is depicted in the figures below, showing how the energy in the other Nyquist zones gets translated to the same digital spectrum. Without analog bandpass filtering, all these bands will downconvert through the sampling process to the same frequency range, leading to a significant increase (increase in the noise floor even if there are no other signals present if the amplified noise floor in front of the A/D Converter is not bandpass or lowpass filtered in any way, as said earlier, out to the input analog bandwidth of the A/D Converter.


That said, in your case of a 100 MHz center frequency, the 100 MHz lands directly on a harmonic of the sampling clock and therefore maps to 0. Unless you are dealing with a complex signal or a real signal in a synchronous system, this would be a poor choice for a center frequency or sampling rate (by synchronous, I mean the signal of interest is coherent to the sampling clock such that you are assured it is exactly centered on 100 MHz and complex symmetric on each side of 100 MHz). The reason is, any offset in center frequency will cause aliasing in the image that gets mapped to 0 resulting in severe distortion. (Exceptions to this would be in closed-loop systems that will drive any offset to exactly 0). If you use complex sampling with resulting quadrature I and Q signal paths then the spectrum is unique from $-f_s/2$ to $+f_s/2$ and this will be a non-issue. For real signals it is common practice to center the signal near $f_s/4$ and multiples there-of just as I have done in these figures as it optimally relaxes the requirement on your analog anti-alias filter (the images will be equidistant as in my figures). It is common to then use a complex down-converter to then move the signal to baseband appropriately without aliasing issues. So to do this you would either shift your center frequency to 102.5 MHz, or shift your sampling clock (using some math) such that 100 MHz is mid-way in a Nyquist zone. You would then design a bandpass digital fitler that is in your primary Nyquist zone of $0$ to $f_s/2$ or as your tool is givng you in normalized terms $0$ to $1$.


when signal is centred at non-zero centre frequency? Do you mean you have a complex-valued signal so the spectrum is not symmetric about zero? Or is it just that you want to implement bandpass sampling (because you say the center frequency is higher than the sampling frequency) ? Please include this information in by editing your question and we can attempt to answer. $\endgroup$