12
$\begingroup$

I was thinking about the DFT windowing subject and a thought came to my mind. A DFT will yield the spectrum of a signal convoluted with spectrum of the window used, therefore having a main lobes and side lobes.

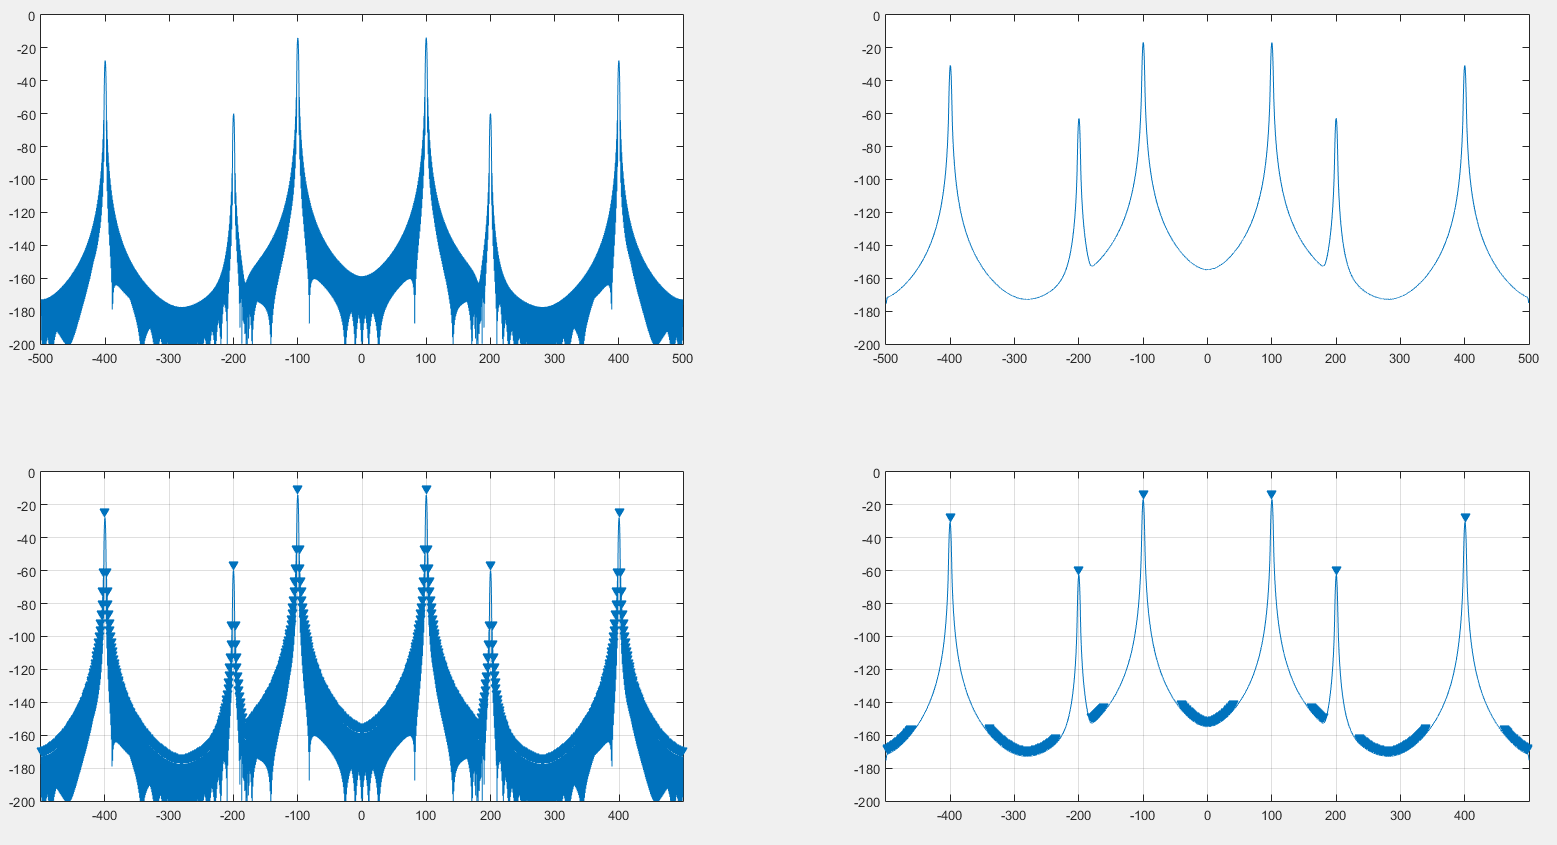
I figured it would be possible to remove the window effect on the spectrum of the signal by convoluting again both the signal and the window spectrum magnitude, and it did indeed works as you can see on the following image.

enter image description here

Left is the original spectrum generated with a hanning window. Right is the spectrum convoluted by the DFT of a hanning window. Top is the Spectrum itself, bottom is MATLAB findpeaks result.

I never read anything regarding this technique, but I am pretty sure I haven't invented anything there. So I am wondering if there is a benefit of doing this processing on the spectrum or if there is a downside to it that I am not seeing.

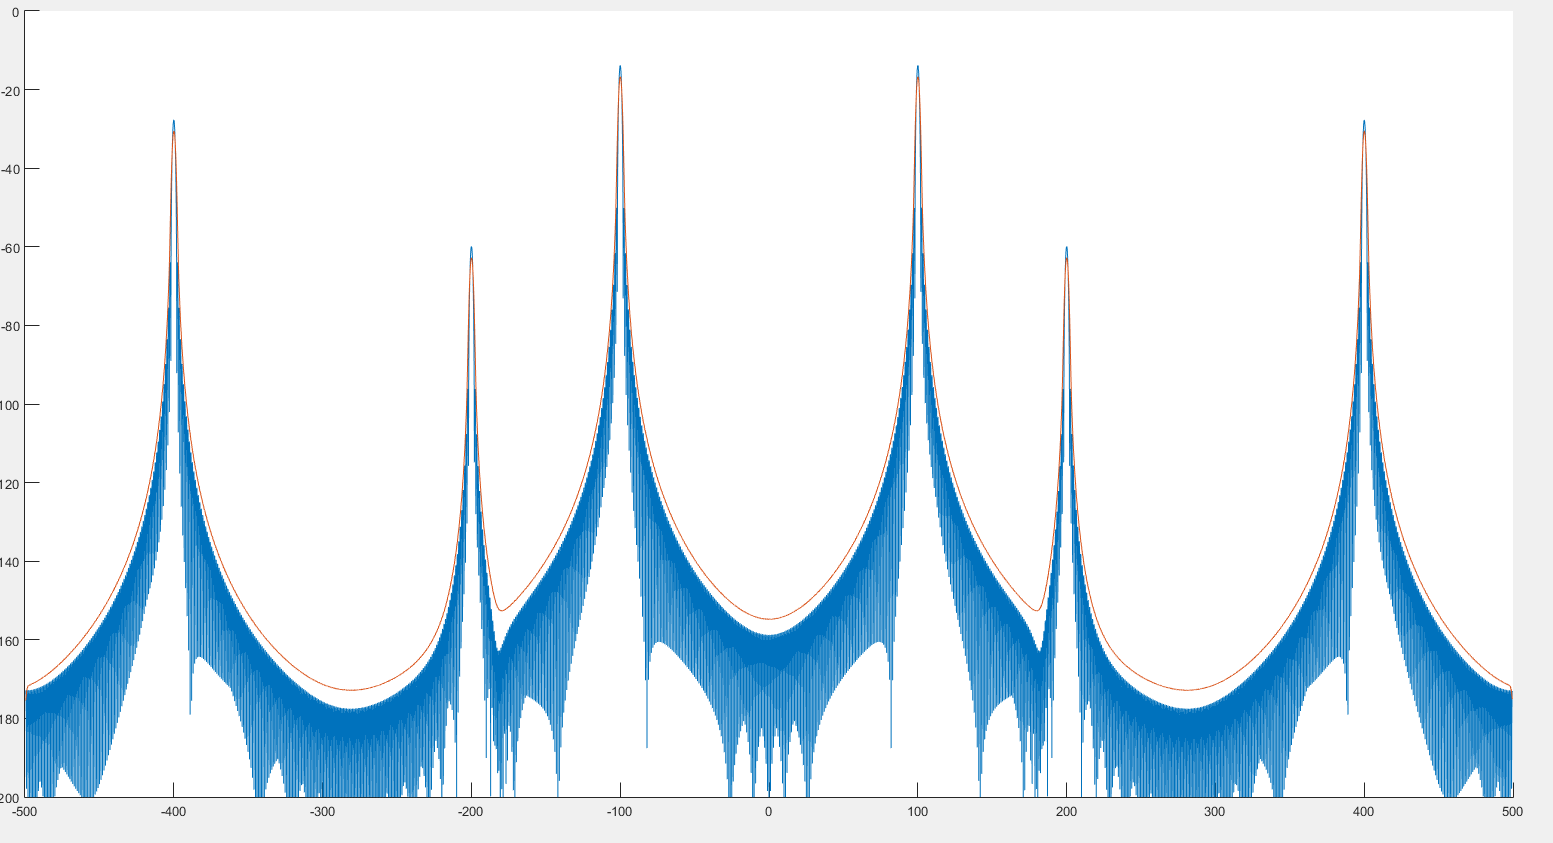
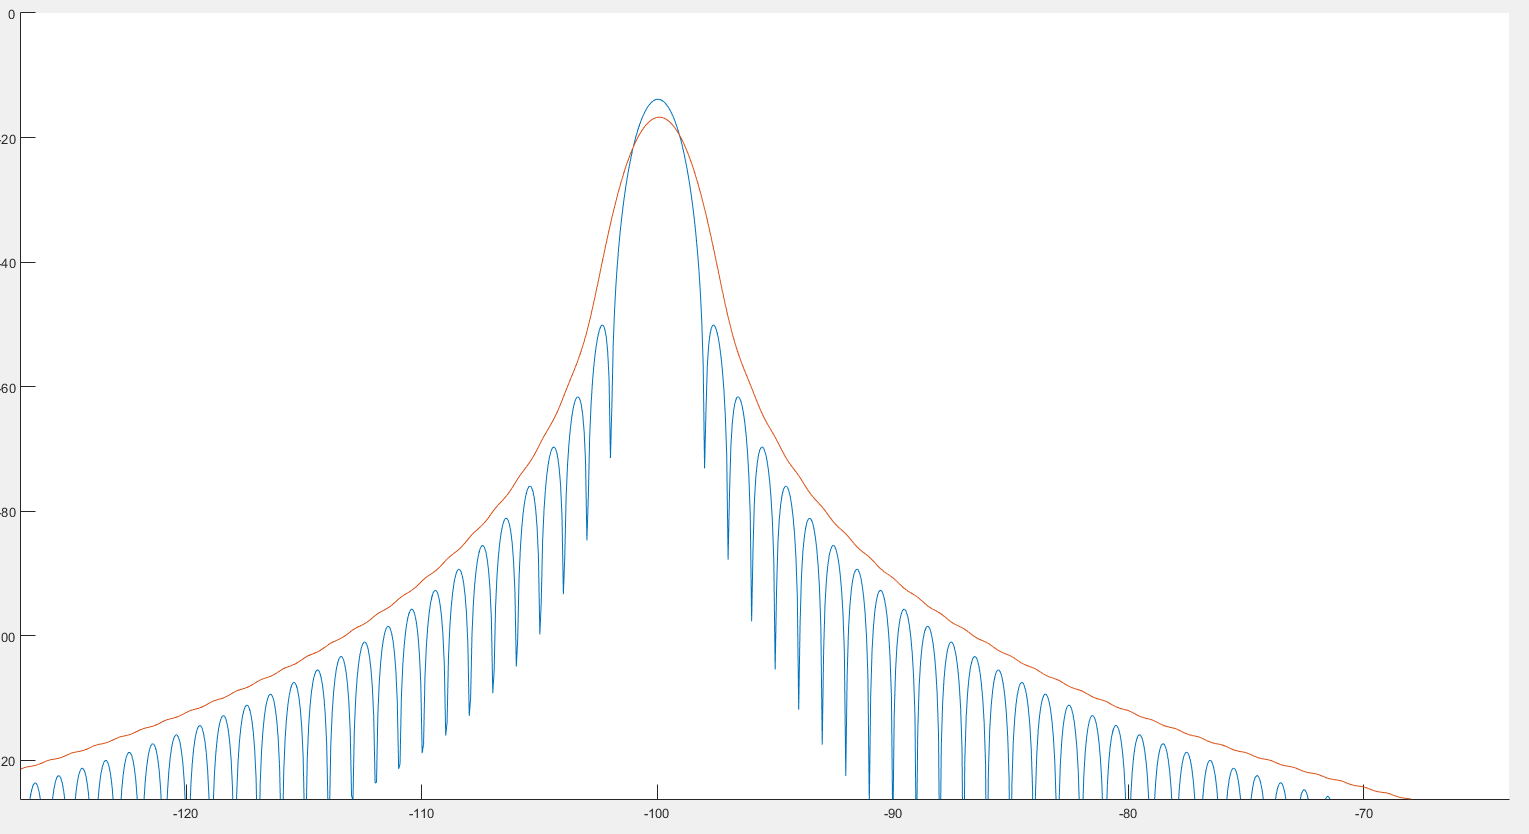
From what I see, this could help peak detection as we can see on the previous image. Also, it looks like the spectrum is a little bit distorted as we can see on the 2 following images. :

enter image description here enter image description here

Where the blue graph is the spectrum and the red graph the post-convoluted spectrum.

  • Any thought about this?
  • Is there a problem that could arise from this post-FFT convolution?
  • Any paper that treats the subject?

EDIT

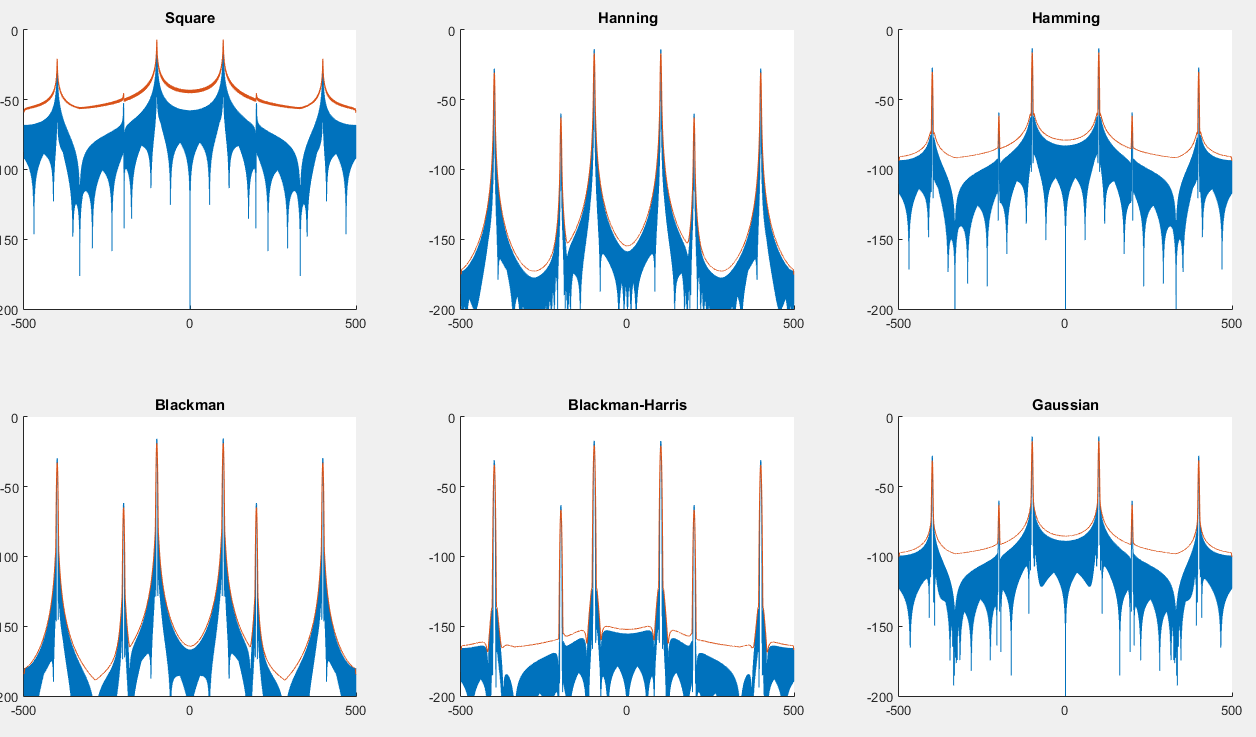
You can find a script here that will generate the following graph:

enter image description here

$\endgroup$
2
  • 1
    $\begingroup$ Could you provide the code which you used to plot the figures? I assume that the smoothness of the convolved function is just an issue of resolution. You can't undo the windowing by convolving yet one more time with the same window (you would indeed need to deconvolve, which is what rbj's answer refers to). Furthermore, a real improvement would be an increased frequency resolution, and/or an increased sidelobe suppression, none of which is achieved here. Finding the "correct" peaks is relatively easy for both functions. $\endgroup$
    – Matt L.
    Dec 31, 2016 at 10:47
  • $\begingroup$ I just edited my post to add an example of code. $\endgroup$ Dec 31, 2016 at 15:05

4 Answers 4

2
$\begingroup$

There is, in fact, a downside to your suggestion: the signals you showed are all very clearly divided into their frequency components, but in general, real-life signals tend to be more noisy.

Depending on the application, you'd want as much leakage dampening (higher main lobes/smaller side lobes of a signal frequency in the transformed spectrum) or, as another example, the narrowest possible main lobe.

In your plots, it is visible that smoothing the magnitude spectra with a window does the opposite of these: the main lobes get wider and smaller, while leakage products from transforming a finite time signal gain in power. Applied to noisy signals, this would yield a significant disadvantage.

Your suggestion, however, is still pretty useful for peak identification!

$\endgroup$
2
$\begingroup$

staying faithful to the subject "removing window effect in freq domain via convolution" (despite the OP perhaps wanted to achieve something else or something similar), I feel to add my comment having personal experience with this specific topic.

Often I have the necessity to remove a Hann window in frequency domain, working in a STFT framework which uses Hann windowed frames as default, to carry advanced spectral processing where the input spectrum is expected as NON windowed instead (eg. overlap-save convolution or filtering).

In a word: yes you can. Despite mathematically removing a window (either in time or frequency domain) implies reconstructing data which are lost forever, in practice you can with a likely minimal loss.

Let' s take a Hann (rised cosine) window. Its time domain formula is y=(1-cos(pi*x))/2 with x ranging from zero to and excluding one thru the frame. Its corresponding frequency domain representation is bin0=(0.5,0i), bin1=(-0.5,0i). To remove its effect in time domain you may simply want to divide the signal by the above said window function. To do the same in frequency domain, you can simply convolve the spectrum to be un-windowed with the spectrum of the reciprocal of said function. Since this function is zero at both ends (actually it is mathematically zero only at the first point, unless of rounding errors), to avoid infinity you can simply exchange infinity with a large value like 10000 or so. The result of such convolution is the un-windowed spectrum. By converting it to back to time domain, you can of course detect a slight degradation affecting the very first and very last points, which is expectable, but in practice the process can be done.

Perhaps you can' t remove a rectangular window though, because the amount of data lost by multiplying large areas of the signal by zero is impossible to recover in theory. But I think this depends on the spectrum content. For example, if it is the spectrum of a plain sinusoid, by removing the rectangular window pattern by convolving with the spectrum of a function which is a high value where the rectangle was zero, and one where it was one (i.e its reciprocal), you can still perhaps obtain (substantially) the spectrum of a sinusoid to reconstruct the whole signal.

UPDATE: I am adding this in case somebody interested may end up here in the future by a google search. Also, this is something very specific about advanced spectral manipulation which I came up with by my efforts and is NOT covered anywhere as far as I know.

A Hann window CAN BE REMOVED WITH SOME VERY SIMPLE OPERATIONS IN FREQUENCY DOMAIN losing only the first sample, without resorting to a convolution or to conversion to time domain to divide by the reciprocal window function, both processes which involve unnecessary loss of precision.

As a premise, from a mere information perspective, when you apply a Hann window

(1-cos(x*PI2/z))/2 0<=x<z

to a block of z samples, you just lose ONE sample: the first sample, because only at x=0 the window function is zero, so that sample is lost forever. Therefore, if you accept that you will never be able to recover the first sample, the following pseudocode will perfectly remove a previously applied Hann window in frequency domain.

S[] is the half-complex spectrum (positive frequencies only, from bin zero = DC to bins z/2 = Nyquist) to "de-window". s and k are real variables. M,P and TMP are complex variables. z is the frame size. nb is the number of bins which is equal to z/2+1

s=0
k=1
iterate cnt from nb-2 to 1
{
  s = s + im(S[cnt]) * k
  k=k+1
}


im(S[0]) = -2 * s / z
P=0
M=0
iterate cnt from 0 to nb-1
{
  TMP = S[cnt] * 4
  P = P + M
  S[cnt] = P
  M = M-TMP  
}

S[0] = S[0]/2
S[nb-1] = S[nb-1]/2

The first time-domain sample will remain undefined as stated previously. If needed, its value can be discovered and changed easily still remaining in frequency domain, keeping in mind that the value of the first time domain sample is equal to the sum of all the real parts of the spectrum bins.

Such a trick can only be applied to a Hann window since its spectrum is simply made of two bins, a DC and an unitary frequency component

$\endgroup$
2
$\begingroup$

it's a good question and a good insight that i'm pretty sure others have had. the de-convolution in the frequency domain is like multiplying in the time domain and if you're deconvolving the effect of a Hann window in the frequency domain, it's like your dividing by the effect of the Hann window in the time domain. at the tails where the Hann window goes to zero, there's dividing by too small of a number to worry about.

usually the window effect is left in because if you're transforming back you might want the window's effect in the time domain. or if you're never transforming back (this is an analysis or modeling alg and not a modification alg) then you're only interested in parameters that are properties of those peaks, and you just deal with the known effect of convolving with a known kernel and that might modify an extracted parameter in a deterministic manner. then you just compensate for that in your extracted parameter.

lastly, depending on what you're doing, you might want to consider using a gaussian window for analysis. has very little sidelobe problem and under linear conditions (like a filter), each windowed sinusoid retains the windowed shape when transformed back to the time domain. that window can be undone and a Hann window applied after transforming back to the time domain.

$\endgroup$
4
  • 6
    $\begingroup$ In principle I agree to your statements. Though, the OP is not talking about deconvolution, but convolving the obtained spectrum with the spectrum of the hanning window. (i.e. essentially windowing with a hanning-squared window) $\endgroup$ Dec 31, 2016 at 10:05
  • 1
    $\begingroup$ no, the OP is talking about removing the effect, not doubling the effect. division is the same as multiplication by the reciprocal. it is multiplying by such a number that gives you the result we call the quotient. being that convolving in one domain is the same as multiplying in the other domain, then deconvolution is the same as convolving with something specially determined. $\endgroup$ Dec 31, 2016 at 18:07
  • 2
    $\begingroup$ The OP is talking about removing the ripples, by performing a convolution of the obtained spectrum with the spectrum of the window. This yields multiplication of the signal with the squared window (one window from the initial multiplication in time, the second one coming from the convolution in frequency) $\endgroup$ Dec 31, 2016 at 20:02
  • 2
    $\begingroup$ Well, not exactly. I do a convolution of the magnitudes of the spectrum which yield a different results from the multiplication of the squared window. I am not sure what it represents mathematically... I see it as a cross correlation between both spectrum magnitudes (since windows spectrums are symmetrical). $\endgroup$ Nov 4, 2017 at 3:15
0
$\begingroup$

The technique you used of smoothing the spectrum is often used when analyzing the spectrum itself and you don't care about the effects in the time domain (e.g. doing frequency based signal detection or bandwidth measurement). There's not even a requirement that the window used for smoothing be the same as the window used in the time domain. One of the main reasons to use a time-domain window before the DFT is to minimize the discontinuity in the wrap-around that the DFT assumes at the ends of the signal (the DFT is inherently circular). The purpose of smoothing in the frequency domain is to facilitate analysis such as peak detection or bandwidth measurement. The "best" window for one may not be the "best" window for the other. In fact, I have never seen the DFT of a window used for spectral smoothing. I have seen reasonable results by using a simple boxcar (rect) window to smooth the spectrum.

$\endgroup$
2
  • $\begingroup$ The way I understand it, is that I am doing a cross correlation with the spectrum, threfore getting peaks in the center of the main lobes. Using the time domain windows seems like the obvious choices and I don't see why I would use a boxcar window cross correlation to find where the hanning window spectrum is located. Why would we want something else than the same window ? $\endgroup$ Mar 29, 2017 at 0:57
  • $\begingroup$ Yes, the result you describe is a convolution with the autocorrelation of the window, but that is just convolving with a different window. The autocorrelation will result in a VERY tight peak at DC. So you effectively convolved the signal spectrum with a very tight low pass filter. It is the frequency response of this filter that is giving you the result you see, not the fact that it is an autocorrelation. The fact that it is an autocorrelation is coincidence. $\endgroup$
    – cassman
    Mar 29, 2017 at 12:53

Your Answer

By clicking “Post Your Answer”, you agree to our terms of service and acknowledge you have read our privacy policy.

Not the answer you're looking for? Browse other questions tagged or ask your own question.