3
$\begingroup$

Assume signal $x$, sampled at $f_s = 44100\; \mathrm{Hz}$. I tried to filter it using the Butterworth bandpass filter ( $30\; \mathrm{Hz} - 70\; \mathrm{Hz}$) of order $8$. However, as a result I get a vector with most elements being NaN (and some of them extremely small, approx. $-2.5 \cdot 10^{306}$`).

If I try the same filter of order $6$, I get results as expected. What could be possible reason for order $8$ filter to 'explode'?

Here is the MATLAB code, just in case I made an error which I don't see:

[b, a] = butter(4, [60 / fs, 140/fs]);
x_filtered = filter(b, a, x);
$\endgroup$

4 Answers 4

4
$\begingroup$

Basically you never want to use the Transfer Function representation (with b and a) and rather use the Zeros-Poles-Gain (z,p,k). This will allow you to avoid the numerical errors. In your case you might design your filter in following way:

fs = 44100;           % Sampling frequency
Wp = [30, 70]/(fs/2); % Pass band frequencies (as normalized frequency)
Ws = [20, 90]/(fs/2); % Stop band frequencies
Rp = 3;               % Ripple at pass band
Rs = 50;              % Ripple at stop band

[n, Wn] = buttord(Wp, Ws, Rp, Rs);     % Get order and omega vector
[z, p, k] = butter(n, Wn, 'bandpass'); % Design filter accordingly
[sos, g] = zp2sos(z, p, k);            % Convert to state matrix
Hd = dfilt.df2sos(sos, g);             % Create the filter object

Which for some dummy random signal:

x = rand(1,100000);
y = filter(Hd, x);

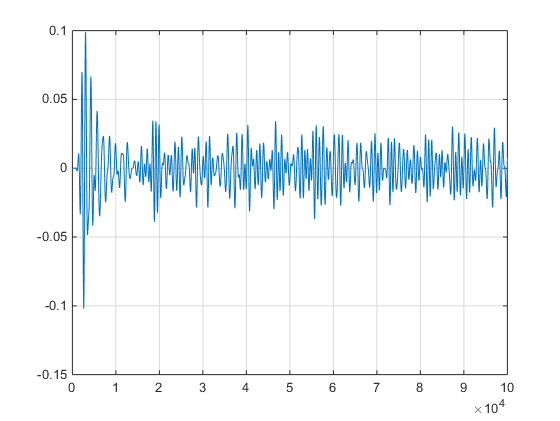
Will produce a stable output:

enter image description here

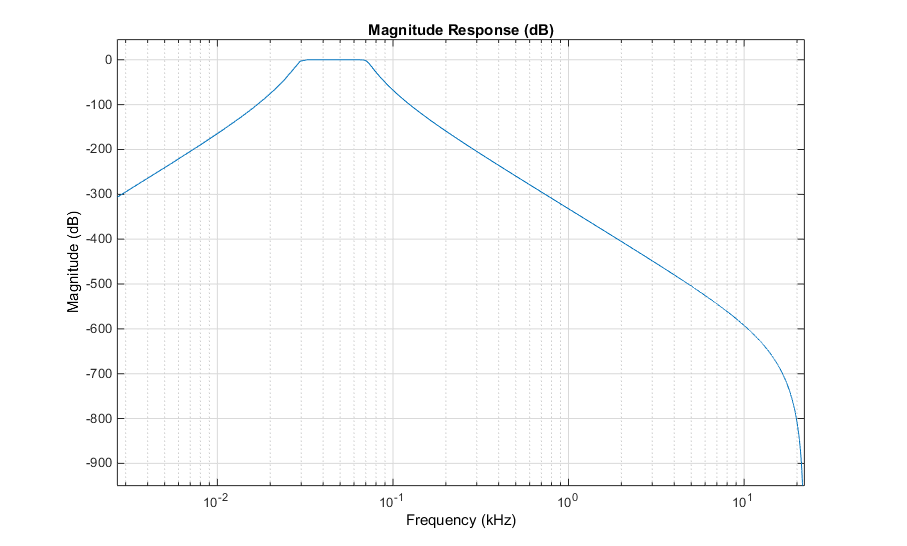
And here is the filter frequency response (everything looks as requested):

enter image description here

$\endgroup$
4
  • $\begingroup$ Very helpful answer. However, wouldn't the frequency range $ 30 \mathrm Hz - 70\mathrm Hz$ be $[ 60 - 140 ] \cdot fs$ ? $\endgroup$
    – kruk
    Commented Aug 28, 2014 at 9:26
  • $\begingroup$ @kruk: Indeed you are right, we want normalized frequency $\times \pi \text{ rad/sample}$, thus I was missing factor of 2! Sorry for that, I wrote this being on travel. $\endgroup$
    – jojeck
    Commented Aug 28, 2014 at 9:52
  • $\begingroup$ one more thing is not clear for me: $n$ obtained by buttord function. reference for butter function says: for bandpass, butter will return 2n filter. should $n$ provided by buttord function be used in butter, or should it be $n/2$ ? $\endgroup$
    – kruk
    Commented Aug 28, 2014 at 10:14
  • $\begingroup$ @kruk: That's true, but buttord is already compatible with butter and you don't need to worry about that. In the manual you can find: Use the output arguments n and Wn in butter. $\endgroup$
    – jojeck
    Commented Aug 28, 2014 at 10:21
3
$\begingroup$

The higher the order, the more poles that need to be fit around a small semi-circular-like ring, and right at the edge of the unit circle. The smaller the ratio of the filter's frequency to the sample rate, the smaller this circular ring becomes in relationship to the unit circle. Try to stuff enough poles into a small enough area and normal numerical noise might move one around to a bad location (one that amplifies anything to infinity, or a divide by zero).

One technique to possibly improve stability would be to down-sample your signal by a very large ratio before the Butterworth low-pass filter. This will enlarge the semi-circular-like ring, and thus move the poles farther apart and away from the unit circle.

$\endgroup$
2
  • $\begingroup$ This technique worked for already for downsampling of order 3 (filtering of signal downsampled by factor 2 was still unstable). Thanks! Could you please share some good link with detailed explanation of the ring you're mentioning? $\endgroup$
    – kruk
    Commented Aug 28, 2014 at 9:48
  • $\begingroup$ The 2nd half of this Maxim app note has some nice plots: maximintegrated.com/en/app-notes/index.mvp/id/733 $\endgroup$
    – hotpaw2
    Commented Aug 28, 2014 at 16:57
1
$\begingroup$

Other answers explain how to avoid this, but to clarify the actual cause, it is caused by exceeding the precision limit of the data type used to store the sample values (which I believe is double precision floating point in MATLAB) resulting in an underflow. The reason it only happens with higher orders of the filter is that the higher the order the smaller the coefficients may become. Very small coefficients multiplied by very small signal values can lead to floating point denormals, which in turn can lead to floating point NaN (not a number).

Jargon busting links:

http://en.wikipedia.org/wiki/IEEE_754-1985

http://en.wikipedia.org/wiki/Arithmetic_underflow

$\endgroup$
2
  • $\begingroup$ I don't think this entirely correct. What happens is that the feedback coefficients are very, very close to one and the numerical problem is that 1+dx = 1 for floating point formats if dx << 1. $\endgroup$
    – Hilmar
    Commented Aug 28, 2014 at 13:40
  • $\begingroup$ I don't know what "if dx << 1" is supposed to mean, but regardless how would things being rounded to 1 cause NaN's to appear? I would expect the contrary, that should tend towards numerical stability. $\endgroup$
    – PAK-9
    Commented Aug 28, 2014 at 15:15
-1
$\begingroup$

Read the limitations section of the documentation of the butter function. http://www.mathworks.com/help/signal/ref/butter.html#bt5pm8a

$\endgroup$

Your Answer

By clicking “Post Your Answer”, you agree to our terms of service and acknowledge you have read our privacy policy.

Not the answer you're looking for? Browse other questions tagged or ask your own question.