I'm new to signal processing. I'm plotting a signal in the time-domain in matlab. I don't understand which parts of the signal are high frequencies and low frequencies, can someone explain what a high and low frequency is, and how to see high frequencies and low frequencies on a graph?
-
3$\begingroup$ Read about FFT in MATLAB. You cannot always "see" the high and low frequencies by plotting the signal in the time domain, though in a few toy examples, the results would be obvious enough. $\endgroup$– Dilip SarwateCommented Dec 27, 2011 at 14:21
-
$\begingroup$ so if i plot using fft i would be able to easily see what frequencies occur more often and the ones that occur the most are the ones that have a higher frequency, right? $\endgroup$– user1117262Commented Dec 27, 2011 at 14:32
-
6$\begingroup$ Broadly speaking, yes, the FFT will reveal the frequency content, but be aware that there are many niggling details that can trip up the neophyte. It is quite easy to get answers that are misleading by not applying the FFT properly. $\endgroup$– Dilip SarwateCommented Dec 27, 2011 at 14:55
-
$\begingroup$ high frequency for human speech is 3000Hz and low frequency for human speech is 300Hz.can u give some ideas about what are the difference between general and specific purpose for Ic741?? $\endgroup$– priyadharshiniCommented Dec 28, 2016 at 14:22
3 Answers
The high frequencies contribute to the fast varying parts of the signal(the sharp transitions), while the low frequencies contribute to the slow variations of the signal in the time domain.
You might want to take a look over here: http://cns-alumni.bu.edu/~slehar/fourier/fourier.html
Also, if you have the time you might want to take a look at this online course: http://academicearth.org/courses/the-fourier-transform-and-its-applications You won't regret it.
High and low frequencies are dependent on the application. A low frequency for wifi would be 2.4GHz, while a high frequency would be 5GHz. For human speech a low frequency is 300Hz, while a high frequency is 3000Hz.
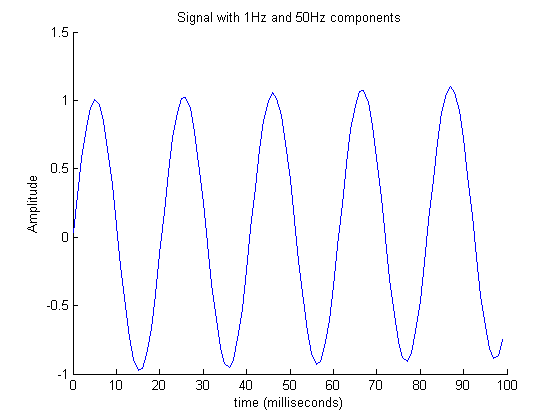
A graph of a fft (Fast Fourier Transform) allows us to visualize different frequencies. This example is adapted from Matlab's fft help. The following figure shows the first 100 out of $2^{20}$ samples of a time signal with two frequencies. Note how it is difficult to see the 1Hz component in this figure.

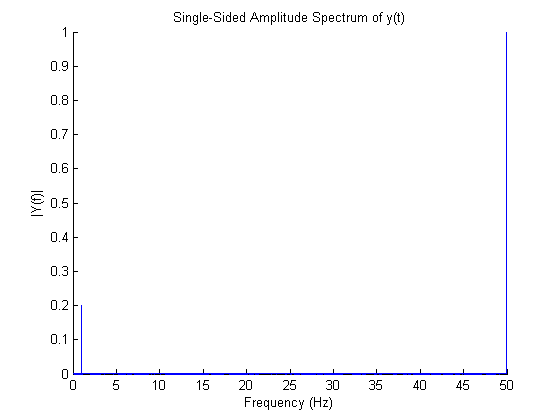
To see the frequency content we plot the spectrum as show in the following figure. Here we can clearly see the two frequencies - one at 1Hz and the other at 50Hz.

Here is the code I used to generate these plots.
fs = 2^10;        %sample frequency in Hz
T  = 1/fs;        %sample period in s
L  = 2^20;        %signal length
t  = (0:L-1) * T; %time vector

A1 = 0.2; %amplitude of x1 (first signal)
A2 = 1.0; %amplitude of x2 (second signal)
f1 = 1;   %frequency of x1
f2 = 50;  %frequency of x2

x1 = A1*sin(2*pi*f1 * t); %sinusoid 1
x2 = A2*sin(2*pi*f2 * t); %sinusoid 2
y  = x1 + x2;

%Plot signal
figure;
set(gcf,'Color','w'); %Make the figure background white
plot(fs*t(1:100), y(1:100));
set(gca,'Box','off'); %Axes on left and bottom only
str = sprintf('Signal with %dHz and %dHz components',f1,f2);
title(str);
xlabel('time (milliseconds)');
ylabel('Amplitude');

%Calculate spectrum
Y = fft(y)/L;
ampY = 2*abs(Y(1:L/2+1));
f = fs/2*linspace(0,1,L/2+1);
i = L/fs * (max(f1,f2)) + 1; %show only part of the spectrum

%Plot spectrum.
figure;
set(gcf,'Color','w');  %Make the figure background white
plot(f(1:i), ampY(1:i));
set(gca,'Box','off');  %Axes on left and bottom only
title('Single-Sided Amplitude Spectrum of y(t)');
xlabel('Frequency (Hz)');
ylabel('|Y(f)|');
-
$\begingroup$ Good explanation, but I feel it's a little unfair to say that you can observe the 1 Hz component in the transform but not in the time domain. If you looked at a few seconds (or even 1 second) of
yin the time domain the wander would show up. I'd also recommend a window on the FFT, just so others who come across this example don't get the wrong idea. $\endgroup$– mtrwCommented Dec 27, 2011 at 23:17 -
$\begingroup$ @mtrw: I agree. If I show more of the signal in the time domain, seeing that there is more than one frequency would be easier. As far as windowing, I'm not sure I understand of which wrong idea you are thinking. There are lots :-) $\endgroup$ Commented Dec 27, 2011 at 23:28
-
$\begingroup$ How about the wrong idea that it's ok to look at a spectrum of a signal that's not periodic in the transform frame if you didn't apply a window first? $\endgroup$– mtrwCommented Dec 27, 2011 at 23:33
-
1$\begingroup$ It is OK to "look" at the spectrum of a signal not periodic in the transform aperture. Windowing is information lossy. There are sometimes other ways of dealing with the various artifacts. $\endgroup$– hotpaw2Commented Dec 28, 2011 at 1:43
It really depends on what kind of time-domain signal at which you are looking, and how you are looking at it. Sometimes it's easy to see. Sometimes it is not.
If you are plotting something like amplitude (voltage, pressure, height, etc.) against time, and you see lots of up and down action in a relatively short distance, those may be due to higher frequency spectral content. If you see some up and down trends over a much larger span those may represent some lower frequencies. The two may be mixed (added or summed) together over the same span. If you see repeated repetitions of a waveform, that may represent it's own kind of frequency. Of course this all depends on picking a time scale factor relative to the contextual meaning of your "high" and "low". You may need to play with the scale factors to see something of interest.
An FFT may or may not be useful, and might even be wildly misleading. The FFT is more about spectral content in a given aperture width than either high or low frequencies in a signal. For instance it's possible for a sharp-edged low frequency periodic signal to show lot of high frequency content in an FFT, even for a very low frequency of repitition of the actual signal phenomena. People looking for musical pitch too often mistake the two. And FFTs of slices of a longer signal which is absolutely not periodic in the FFT aperture width will misleadingly show up as periodic frequencies in a naive interpretation of the FFT results.
