Trying to get code highlighting to work.
Source Link
fs = 2^10;        %sample frequency in Hz
T  = 1/fs;        %sample period in s
L  = 2^20;        %signal length
t  = (0:L-1) * T; %time vector

A1 = 0.2; %amplitude of x1 (first signal)
A2 = 1.0; %amplitude of x2 (second signal)
f1 = 1;   %frequency of x1
f2 = 50;  %frequency of x2

x1 = A1*sin(2*pi*f1 * t); %sinusoid 1
x2 = A2*sin(2*pi*f2 * t); %sinusoid 2
y  = x1 + x2;

%Plot signal
figure;
set(gcf,'Color','w'); %Make the figure background white
plot(fs*t(1:100), y(1:100));
set(gca,'Box','off'); %Axes on left and bottom only
str = sprintf('Signal with %dHz and %dHz components',f1,f2);
title(str);
xlabel('time (milliseconds)');
ylabel('Amplitude');

%Calculate spectrum
Y = fft(y)/L;
ampY = 2*abs(Y(1:L/2+1));
f = fs/2*linspace(0,1,L/2+1);
i = L/fs * (max(f1,f2)) + 1; %show only part of the spectrum

%Plot spectrum.
figure;
set(gcf,'Color','w');  %Make the figure background white
plot(f(1:i), ampY(1:i));
set(gca,'Box','off');  %Axes on left and bottom only
title('Single-Sided Amplitude Spectrum of y(t)');
xlabel('Frequency (Hz)');
ylabel('|Y(f)|');
Made more direct note of the length of the signal.
Source Link

A graph of a fft (Fast Fourier Transform) allows us to visualize different frequencies. This example is adapted from Matlab's fft help. The following figure illustratesshows the first 100 out of $2^{20}$ samples of a time signal with two frequencies. Note how it is difficult to see the 1Hz component in the time domainthis figure.


fs = 2^10;        %sample frequency in Hz
T  = 1/fs;        %sample period in s
L  = 2^20;        %signal length
t  = (0:L-1) * T; %time vector

A1 = 0.2; %amplitude of x1 (first signal)
A2 = 1.0; %amplitude of x2 (second signal)
f1 = 1;   %frequency of x1
f2 = 50;  %frequency of x2

x1 = A1*sin(2*pi*f1 * t); %sinusoid 1
x2 = A2*sin(2*pi*f2 * t); %sinusoid 2
y  = x1 + x2;

%Plot signal
figure;
set(gcf,'Color','w'); %Make the figure background white
plot(fs*t(1:100), y(1:100));
set(gca,'Box','off'); %Axes on left and bottom only
str = sprintf('Signal with %dHz and %dHz components',f1,f2);
title(str);
xlabel('time (milliseconds)');
ylabel('Amplitude');

%Calculate spectrum
Y = fft(y)/L;
ampY = 2*abs(Y(1:L/2+1));
f = fs/2*linspace(0,1,L/2+1);
i = L/fs * (max(f1,f2)) + 1; %show only part of the spectrum

%Plot spectrum.
figure;
set(gcf,'Color','w');  %Make the figure background white
plot(f(1:i), ampY(1:i));
set(gca,'Box','off');  %Axes on left and bottom only
title('Single-Sided Amplitude Spectrum of y(t)');
xlabel('Frequency (Hz)');
ylabel('|Y(f)|');

A graph of a fft (Fast Fourier Transform) allows us to visualize different frequencies. This example is adapted from Matlab's fft help. The following figure illustrates a time signal with two frequencies. Note how it is difficult to see the 1Hz component in the time domain.


fs = 2^10;        %sample frequency in Hz
T  = 1/fs;        %sample period in s
L  = 2^20;        %signal length
t  = (0:L-1) * T; %time vector

A1 = 0.2; %amplitude of x1 (first signal)
A2 = 1.0; %amplitude of x2 (second signal)
f1 = 1;   %frequency of x1
f2 = 50;  %frequency of x2

x1 = A1*sin(2*pi*f1 * t); %sinusoid 1
x2 = A2*sin(2*pi*f2 * t); %sinusoid 2
y  = x1 + x2;

%Plot signal
figure;
set(gcf,'Color','w'); %Make the figure background white
plot(fs*t(1:100), y(1:100));
set(gca,'Box','off'); %Axes on left and bottom only
str = sprintf('Signal with %dHz and %dHz components',f1,f2);
title(str);
xlabel('time (milliseconds)');
ylabel('Amplitude');

%Calculate spectrum
Y = fft(y)/L;
ampY = 2*abs(Y(1:L/2+1));
f = fs/2*linspace(0,1,L/2+1);
i = L/fs * (max(f1,f2)) + 1; %show only part of the spectrum

%Plot spectrum.
figure;
set(gcf,'Color','w');  %Make the figure background white
plot(f(1:i), ampY(1:i));
set(gca,'Box','off');  %Axes on left and bottom only
title('Single-Sided Amplitude Spectrum of y(t)');
xlabel('Frequency (Hz)');
ylabel('|Y(f)|');
A graph of a fft (Fast Fourier Transform) allows us to visualize different frequencies. This example is adapted from Matlab's fft help. The following figure shows the first 100 out of $2^{20}$ samples of a time signal with two frequencies. Note how it is difficult to see the 1Hz component in this figure.

fs = 2^10;        %sample frequency in Hz
T  = 1/fs;        %sample period in s
L  = 2^20;        %signal length
t  = (0:L-1) * T; %time vector

A1 = 0.2; %amplitude of x1 (first signal)
A2 = 1.0; %amplitude of x2 (second signal)
f1 = 1;   %frequency of x1
f2 = 50;  %frequency of x2

x1 = A1*sin(2*pi*f1 * t); %sinusoid 1
x2 = A2*sin(2*pi*f2 * t); %sinusoid 2
y  = x1 + x2;

%Plot signal
figure;
set(gcf,'Color','w'); %Make the figure background white
plot(fs*t(1:100), y(1:100));
set(gca,'Box','off'); %Axes on left and bottom only
str = sprintf('Signal with %dHz and %dHz components',f1,f2);
title(str);
xlabel('time (milliseconds)');
ylabel('Amplitude');

%Calculate spectrum
Y = fft(y)/L;
ampY = 2*abs(Y(1:L/2+1));
f = fs/2*linspace(0,1,L/2+1);
i = L/fs * (max(f1,f2)) + 1; %show only part of the spectrum

%Plot spectrum.
figure;
set(gcf,'Color','w');  %Make the figure background white
plot(f(1:i), ampY(1:i));
set(gca,'Box','off');  %Axes on left and bottom only
title('Single-Sided Amplitude Spectrum of y(t)');
xlabel('Frequency (Hz)');
ylabel('|Y(f)|');
Source Link

High and low frequencies are dependent on the application. A low frequency for wifi would be 2.4GHz, while a high frequency would be 5GHz. For human speech a low frequency is 300Hz, while a high frequency is 3000Hz.

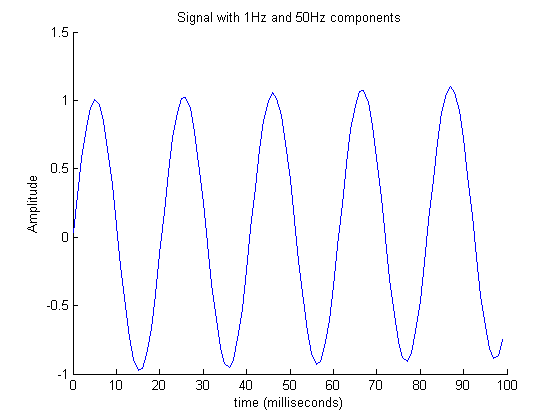
A graph of a fft (Fast Fourier Transform) allows us to visualize different frequencies. This example is adapted from Matlab's fft help. The following figure illustrates a time signal with two frequencies. Note how it is difficult to see the 1Hz component in the time domain.

Time signal

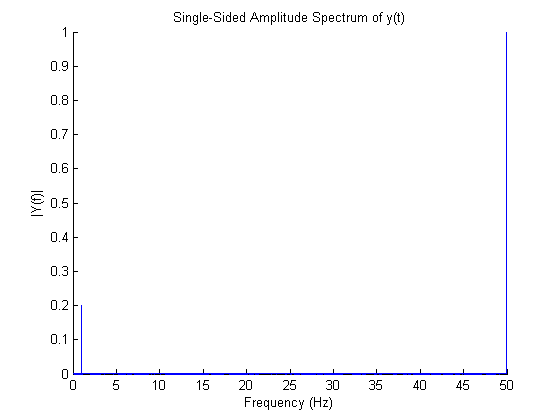
To see the frequency content we plot the spectrum as show in the following figure. Here we can clearly see the two frequencies - one at 1Hz and the other at 50Hz.

Spectrum

Here is the code I used to generate these plots.

fs = 2^10;        %sample frequency in Hz
T  = 1/fs;        %sample period in s
L  = 2^20;        %signal length
t  = (0:L-1) * T; %time vector

A1 = 0.2; %amplitude of x1 (first signal)
A2 = 1.0; %amplitude of x2 (second signal)
f1 = 1;   %frequency of x1
f2 = 50;  %frequency of x2

x1 = A1*sin(2*pi*f1 * t); %sinusoid 1
x2 = A2*sin(2*pi*f2 * t); %sinusoid 2
y  = x1 + x2;

%Plot signal
figure;
set(gcf,'Color','w'); %Make the figure background white
plot(fs*t(1:100), y(1:100));
set(gca,'Box','off'); %Axes on left and bottom only
str = sprintf('Signal with %dHz and %dHz components',f1,f2);
title(str);
xlabel('time (milliseconds)');
ylabel('Amplitude');

%Calculate spectrum
Y = fft(y)/L;
ampY = 2*abs(Y(1:L/2+1));
f = fs/2*linspace(0,1,L/2+1);
i = L/fs * (max(f1,f2)) + 1; %show only part of the spectrum

%Plot spectrum.
figure;
set(gcf,'Color','w');  %Make the figure background white
plot(f(1:i), ampY(1:i));
set(gca,'Box','off');  %Axes on left and bottom only
title('Single-Sided Amplitude Spectrum of y(t)');
xlabel('Frequency (Hz)');
ylabel('|Y(f)|');