1
$\begingroup$

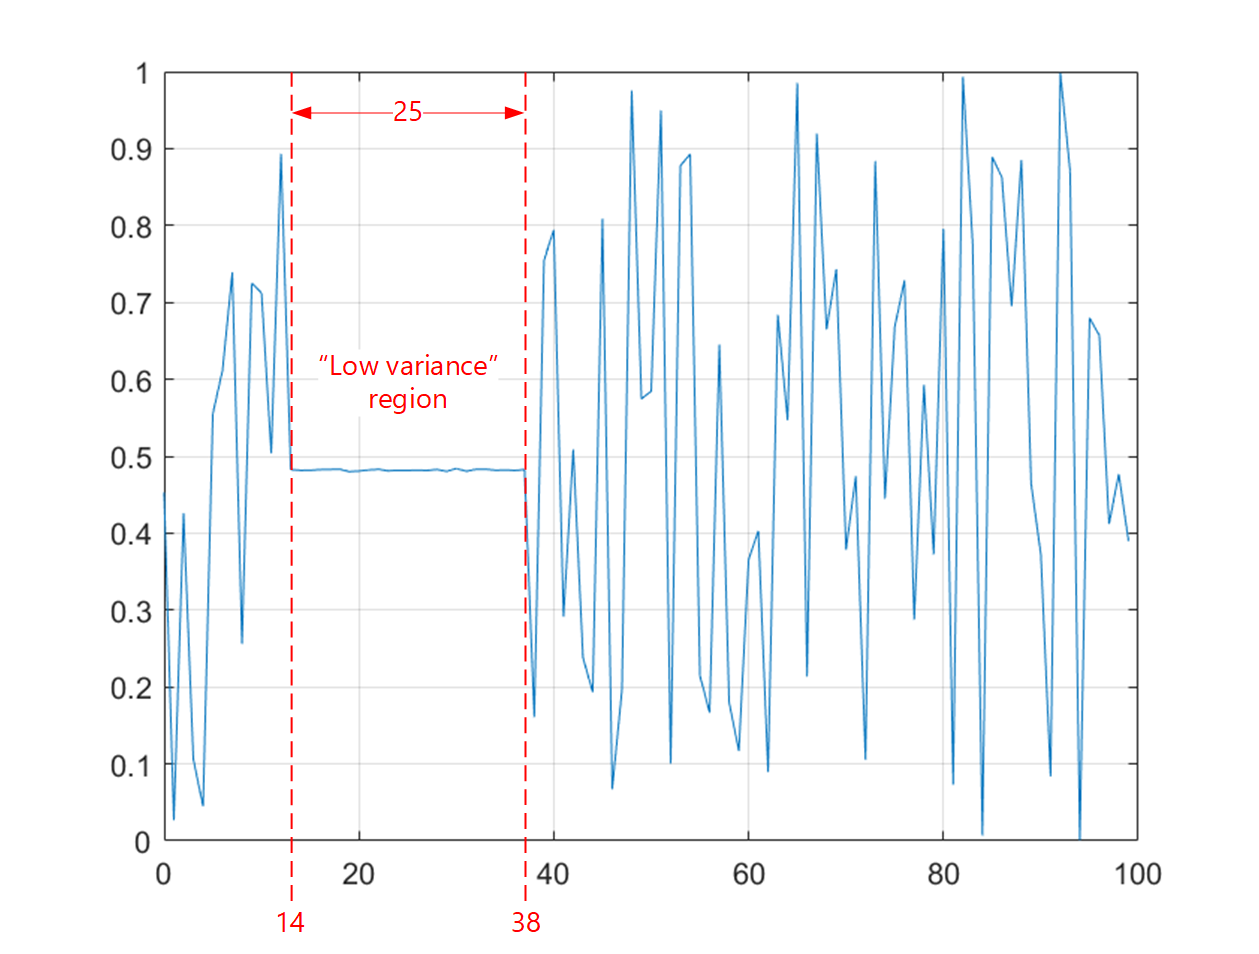
I have a digital signal of fixed length (e.g. 100 samples). Somewhere within this signal is a contiguous region characterized by "low variance". The remainder of the signal is characterized by significantly higher variance.

Here is an example:

graph

I need to estimate the start-time and end-time of the "low variance" region. So, in the example above, the ideal outcome would be to estimate that the "low variance" region starts at time 14 and ends at time 38.

My first idea was to exhaustively search (2D) for the start-time $t_0$ and end-time $t_1$ that maximize the difference between the variances of the two guessed regions: $$ \text{metric} = \text{var}(\boldsymbol{x}_\text{high}) - \text{var}(\boldsymbol{x}_\text{low}) $$

where $\boldsymbol{x}_\text{low}$ denotes the vector of samples in the presumed "low variance" region (between guess $\hat{t}_0$ and guess $\hat{t}_1$), and $\boldsymbol{x}_\text{high}$ denotes the vector of other samples.

However, that idea doesn't work well at all. It tends to underestimate the width of the "low variance" region because adding a few samples of the "low variance" region to the "high variance" region can increase $\text{var}(\boldsymbol{x}_\text{high})$.

I also considered maximizing $\left|\text{mean}(\boldsymbol{x}_\text{high}) - \text{mean}(\boldsymbol{x}_\text{low})\right|$, but that fails if the two regions have similar means (which can happen).

What would be a better algorithm for finding this "low variance" region?

$\endgroup$
7
  • $\begingroup$ @agone The data is unsigned and we can freely assume it's normalized between 0 and 1. The efficiency requirement ultimately boils down to silicon area in digital hardware (in my case, an FPGA). I'm not expecting computational complexity to be an issue. $\endgroup$
    – Harry
    Commented Oct 21, 2023 at 23:17
  • $\begingroup$ @agone Logs are perfectly fine on an FPGA. $\endgroup$
    – Harry
    Commented Oct 21, 2023 at 23:23
  • $\begingroup$ @agone I am not worried about the FPGA implementation at all. I would like to focus on the nature of the algorithm. $\endgroup$
    – Harry
    Commented Oct 21, 2023 at 23:24
  • $\begingroup$ There are many ways of calculating logarithms in FPGAs. Plenty of parallelizable options exist. Like I said, I am not worried about the FPGA implementation at all. $\endgroup$
    – Harry
    Commented Oct 21, 2023 at 23:43
  • $\begingroup$ Hi Harry, I remember reading about change detection in the detection theory book by Steven Kay. If you can find access to that book, I think it'll help $\endgroup$
    – Engineer
    Commented Oct 22, 2023 at 19:03

3 Answers 3

3
$\begingroup$

Your task is somewhat of an instance of offline change detection. Try to take a look at this and its documentation / review paper for some implemented algorithms. If you can assume your signal segments to be made up of i.i.d. samples, with the mean and variance changing between the segments, you could start with CostNormal as the applied cost function ,termed $c_\Sigma$ in the paper, and see if it does the job.

$\endgroup$
2
  • $\begingroup$ Yes, the literature on "change detection" looks the most hopeful. Thanks for these specific tips. I will investigate. $\endgroup$
    – Harry
    Commented Oct 25, 2023 at 10:25
  • $\begingroup$ Please do not post link only answers. $\endgroup$
    – agone
    Commented Nov 18, 2023 at 0:03
0
$\begingroup$

As per signal profile given, choose a window of fix length and stride over it with fixed interval say ts, calculate the energy with each stride. When you get the energy profile with respect to each stride, identify lowest energy region(finding minima of the curve), now you just got to convert this stride to actual time series.

$\endgroup$
1
  • $\begingroup$ How do I calculate the optimal window length? Would an energy profile be helpful if the energy could be any value in either region? $\endgroup$
    – Harry
    Commented Oct 25, 2023 at 10:23
-1
$\begingroup$

The low variance region can be described as the domain of the largest set of the minimal consecutive first derivative values.

At any point in the following process, a proper(Cos...) windowing method of size 3 or limited more, using mean applied would minimize the error at the expense of exact transition values.

Take the log of the absolute value of the discrete derivative:

[log(abs($\boldsymbol{x}_\text{o}$$\boldsymbol{x}_\text{1}$)),log(abs($\boldsymbol{x}_\text{1}$-$\boldsymbol{x}_\text{2}$)),...log(abs($\boldsymbol{x}_\text{n-1}$-$\boldsymbol{x}_\text{n}$))]

The minimums indicate possible regions.

Loop through finding the longest sequence of minimal values. That is your resulting set.

$\endgroup$
7
  • $\begingroup$ I'm not sure if we can guarantee that the first differences would necessarily be smaller in one region or the other. But either way, I think we can remove the log operations because (if I understand correctly), they are redundant. $\endgroup$
    – Harry
    Commented Oct 21, 2023 at 23:27
  • $\begingroup$ Then the hard part would be to define "minimal values". How do we decide which values belong to which region? $\endgroup$
    – Harry
    Commented Oct 21, 2023 at 23:28
  • $\begingroup$ Calculate the mean across a window. $\endgroup$
    – agone
    Commented Oct 21, 2023 at 23:41
  • $\begingroup$ What would be the size of that window? Is there an optimal window size? $\endgroup$
    – Harry
    Commented Oct 21, 2023 at 23:42
  • $\begingroup$ If smaller means better, then I guess I should just set the window size to 1? $\endgroup$
    – Harry
    Commented Oct 21, 2023 at 23:47

Your Answer

By clicking “Post Your Answer”, you agree to our terms of service and acknowledge you have read our privacy policy.

Not the answer you're looking for? Browse other questions tagged or ask your own question.