1
$\begingroup$

I am strugling with how to compute the exact value of delay in time-doamin when knowing phase shift in frequency domain. I have a analog circuit, I sweeped about 30 single tones frequency ranging from 250 MHz to 8 GHz, and achieved amplitude (A) and phase ($\phi$) response of the circuit. I then used that transfer curve (denoted H) (combining amplitudes and phases) to generate response in time-domain (denoted h) using iFFT. Finally, I want to confirm that the h is correctly constructed by taking convolution of a single tone with that h to compare the output power and phase. However, I observed some phase shifts. For sinstance, the phase rotated a value of [65 degree + 2.3*n], where n= [0, 1, 2,.. 30]. I know that that the phase rotation in frequency domain will induce a delay tin time domain, and I need to include that delay when doing verification process. But, I do not know how to estimate the delay in time-domain. Please help me with this issues.

Thank you verymuch.

$\endgroup$

1 Answer 1

2
$\begingroup$

Group delay is the negative derivative of phase with respect to frequency:

$$GD = \frac{-d\phi}{d\omega} \tag{1} \label{1}$$

When the delay in time is fixed, the phase in frequency will be linear versus frequency, increasing at a constant rate in the negative direction ("linear phase"), however when the phase versus frequency is non-linear, the delay will be different for each frequency component leading to group-delay distortion.

To estimate the time delay, compute the derivative of the frequency versus time as given in equation \ref{1}. This is a function available in Matlab, Octave as grpdelay and in Python scipy.signal as group_delay.

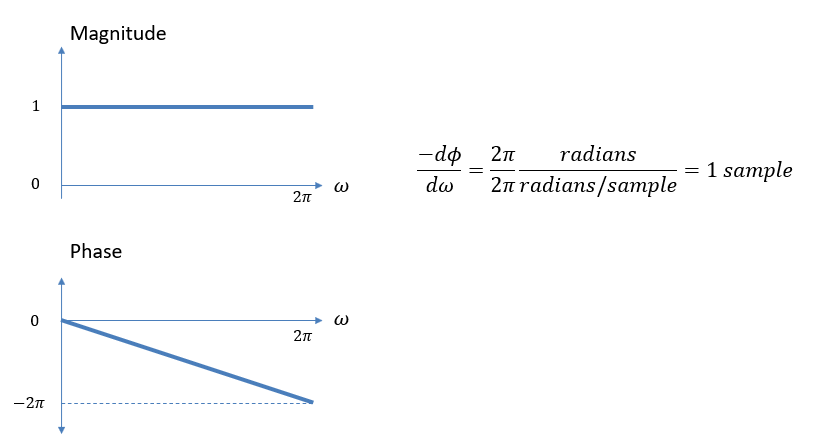
For example, the delay of 1 sample will have a phase versus frequency starting at $0$ radians at $f=0$ and going to $-2\pi$ radians at $f=f_s$ where $f_s$ is the sampling rate. When $f_s$ is in normalized units of radians/sample, the sampling rate is $2\pi $ radians/sample.

Group Delay of a unit sample

In the OP's case with phase linearly increasing $2.5n$ with $n$ from $0$ to $30$ over a frequency range of 250 MHz to 8 GHz, assuming the indices are linearly spaced over that frequency range, the delay would be:

$$GD = \frac{-\Delta \phi}{\Delta \omega}$$

$\Delta \phi$ in radians is $(30-0)\frac{2\pi}{360}$

$\Delta \omega$ in radians/sec is $2\pi (8E9-250E6)$

Therefore, the Group Delay in this case, in units of seconds, would be:

$$GD = \frac{-30/360}{8E9-250E6} \approx -10.8 \text{ ps}$$

Either the phase measurements were actually increasingly negative in contrast to what was provided in the OP, or the group delay is actually negative which is feasible without violating causality, as explained in this post.

$\endgroup$
6
  • $\begingroup$ Thank you very much for your help. $\endgroup$
    – user190055
    Commented May 31, 2022 at 14:08
  • $\begingroup$ Thank you very much for your help. Actually, my circuit also presents nonlinear behavior, including harmonic distortions (HD) and intermodulations. My preliminary thought was that there exists the linear phase delay only. Your comment has encouraged me to explore more about the group delay. I found both linear and nonlinear phase shift when analysing the output waveform. I also induced another issue that the 2nd and 3rd HD phases at the DC are not zero. They maybe come from the ambiguity when using atan2 to compute the phase differences between linear and higher-order frequencies. $\endgroup$
    – user190055
    Commented May 31, 2022 at 14:19
  • $\begingroup$ Are you able to filter the waveform to remove the harmonic distortion or are you getting 3rd order multitone effects such that the harmonics are in band? The solution may be to increase the linearity of the system or decrease the input power. $\endgroup$ Commented May 31, 2022 at 14:28
  • $\begingroup$ Thanks for your suggession. The HDs are in band, i.e., from 0 to several GHz, due to the limited sampling rate. Decreasing the input power can lower the HDs powers, but that cannot tolerate the practical applications. I did try using nonlinear equalizer with wide-band waveform such as Volterra nonlinear equalizer; however, it is not suitable due to too wide signal bandwidth and computational complexity. $\endgroup$
    – user190055
    Commented Jun 1, 2022 at 14:12
  • $\begingroup$ @user190055 You say due to the limited sampling rate (instead of due to third order intermodulation). This makes me wonder if this is due to aliasing and if you have sufficient filtering to remove the higher harmonics prior to sampling? $\endgroup$ Commented Jun 1, 2022 at 18:22

Your Answer

By clicking “Post Your Answer”, you agree to our terms of service and acknowledge you have read our privacy policy.

Not the answer you're looking for? Browse other questions tagged or ask your own question.