0
$\begingroup$

I am working with complex samples, I have a main signal at 630KHz, my Fs is 1.26MHz and BW is 12.6KHz.

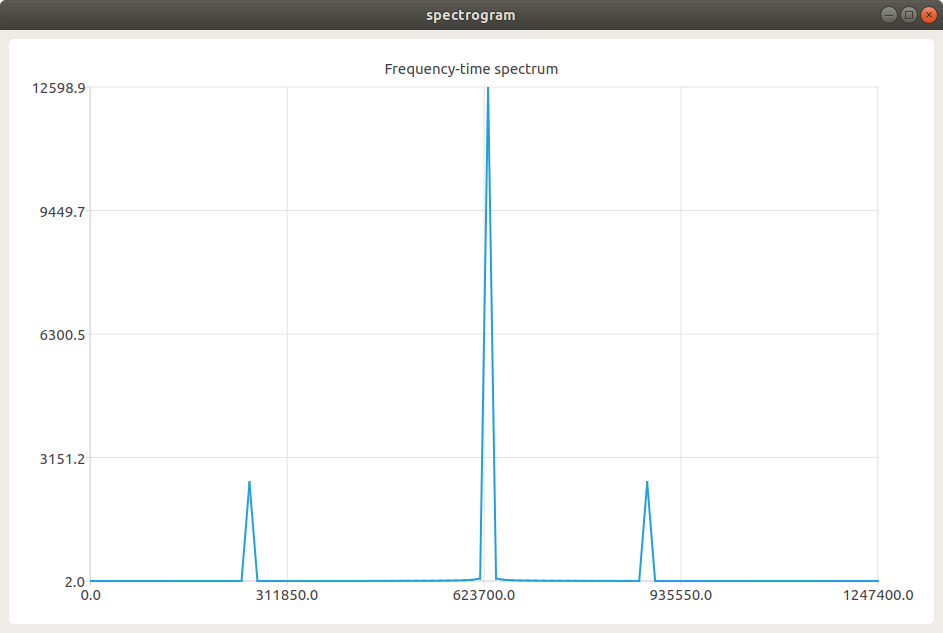
If I plot a frequency-magntitude spectrum it looks like this:

enter image description here

As you can see along with my main signal at 630KHz, there is data I want to filter out so I'm using BPF and I saw the DSP IIR Realtime C++ filter library which provides a great implementation of this.

I have 2 problem, my first one being the sampling frequency, because I have complex samples and filtering works with linear samples I think I don't need them to divide my sampling frequency by half according to the Nyquist law. I had a thought to solve it by multiplying my Fs by 2 making it 2.52MHz? is that true?

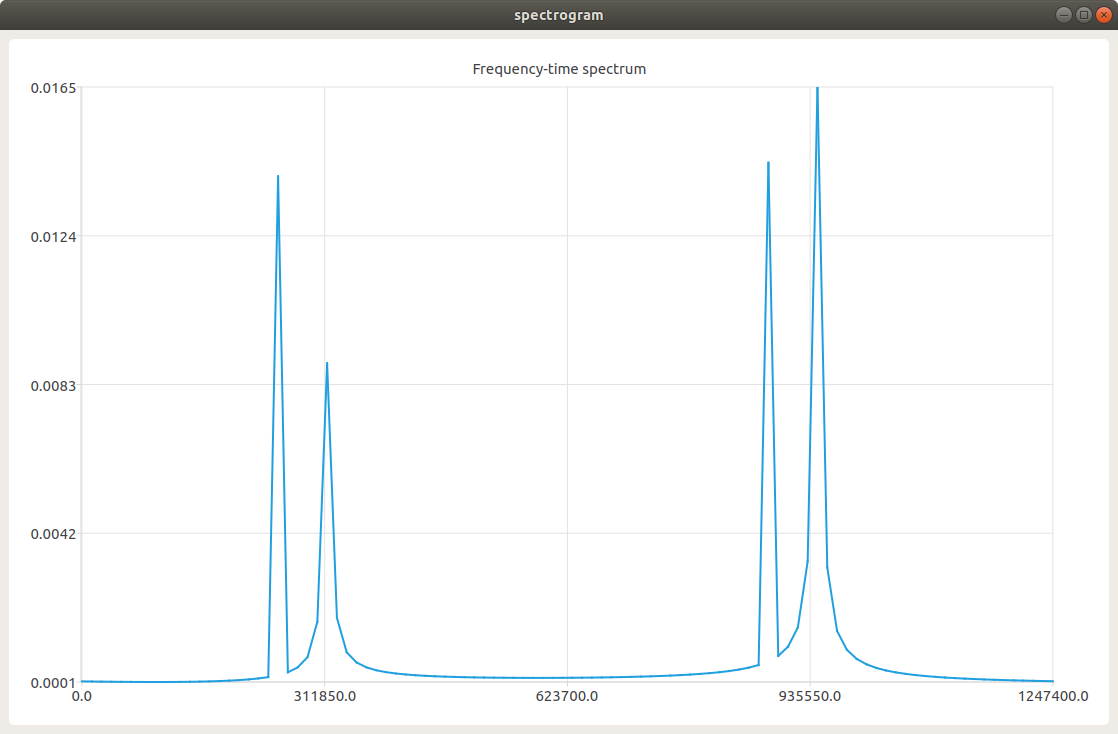
Second problem is more of implementation problem, but when I implied the filter I didn't expect this:

enter image description here

I really have no idea what did it do, but it filtered the main signal I wanted to keep.

This is how I initialized it:

int Fs = 1260000;
int fcenter = 630000;
int BW = 12600;
vector<complex<double>> data;
Iir::Butterworth::BandPass<3> f_real;
Iir::Butterworth::BandPass<3> f_imag;

f_real.setup(Fs*2, fcenter, bw);
f_imag.setup(Fs*2, fcenter, BW);
for(int j = 0; j < 100; j++)
{
    float real_val = f_real.filter(temp_value.real());
    float imag_val = f_imag.filter(temp_value.imag());
    data.push_back({real_val,imag_val});
}

fft(data)
$\endgroup$

2 Answers 2

1
$\begingroup$

You have aliasing. Your signal is under-sampled. The highest frequency in your input is at 935 kHz, so you need a sample rate of at least 1.9 MHz or thereabouts. In practice you always need to more than twice the highest frequency to allow for anti-aliasing filter, etc.

$\endgroup$
1
  • $\begingroup$ That was the case if I had real samples only. But I have complex sampling - "if the signal is complex, the sampling frequency is complex, resulting in twice the terms" $\endgroup$ Commented Jan 5, 2022 at 10:26
1
$\begingroup$

You’ve got a complex input signal, so you can have frequencies from zero up to the sample rate. No worries. Then you design a real filter and apply it to that complex signal, which is probably not what you want.

Remember that your filter H times the input X in the frequency domain:

HX = H(Re(X) + jIm(X)) = HRe(X) +jHIm(X)

Doubling the sample rate used for calculating the coefficients is equivalent to designing the filter at half the center frequency and bandwidth. This means the actual center frequency is 315kHz, the bandwidth is 6.3kHz, and the response at 630kHz is zero because that’s how real band pass filters are designed.

I think your output is showing two things. First, the 630kHz is missing because it is located at a zero. Second, there’s extra and misshapen peaks because you are not using a long enough data set to get the whole impulse response at the beginning. You might be able to get around that by running the filter for a bunch of samples before grabbing your data set.

If I’m following, you want to do a complex filter, but real filters are not complex filters.

Alternatively, you could interpolate your input by a factor of two, the upper half of the spectrum would be empty, and your band pass filter would be in the right spot, which is what Hilmar was suggesting.

$\endgroup$

Your Answer

By clicking “Post Your Answer”, you agree to our terms of service and acknowledge you have read our privacy policy.

Not the answer you're looking for? Browse other questions tagged or ask your own question.