0
$\begingroup$
T = 3*(1/25);
fs = 1000;
t = 0:1/fs:T-1/fs;
x = sawtooth(2*pi*25*t,1/2);
x = (x + 1)*0.5;
subplot(3,1,1)
plot(t,x)
grid on
xlabel('Time t (sec)')
ylabel('Amplitude')

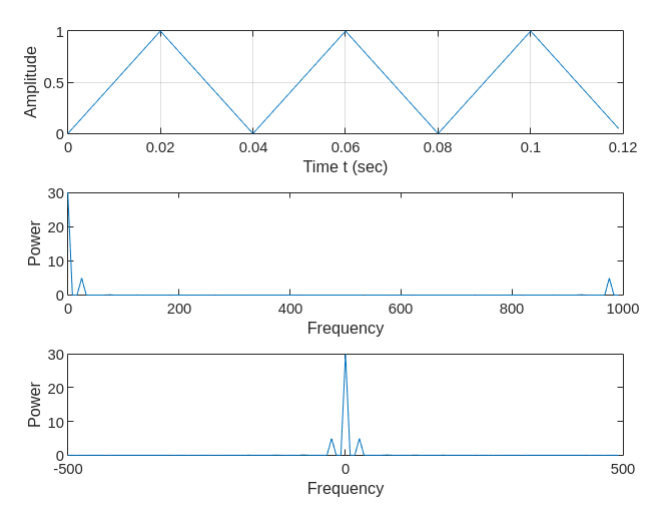
I want to take DFT(Discrete Fourier Transform) of my signal using FFT and FFTShift and find frequency spectrum. However,the graphics I found did not seem right to me. Is there anyone who can help? If there are errors in what I do, I want to find and fix it.

My signal

Following code for second graph:

y = fft(x);
n = length(x);        
f = (0:n-1)*(fs/n);     
power = abs(y).^2/n;   
subplot(3,1,2)
plot(f,power)
xlabel('Frequency')
ylabel('Power')
$\endgroup$
3
  • $\begingroup$ "the graphics I found did not seem right to me" Please edit your question to add what you expected to see, and why what you got seems wrong. $\endgroup$
    – MBaz
    Commented Apr 19, 2020 at 23:51
  • $\begingroup$ I'm actually new and trying to learn. I couldnt find any example for triangle waves. I tried to create the chart with my own interpretation. However, but the graphics that came up didn't seem right to me. I asked to find out if I am wrong because I do not have enough information to make sure what I do $\endgroup$ Commented Apr 20, 2020 at 0:06
  • $\begingroup$ @Oguzhan You have posted the same question some hours back, why not use that?instead of posting the same question? dsp.stackexchange.com/questions/66618/harmonics-in-matlab/… $\endgroup$ Commented Apr 20, 2020 at 6:16

1 Answer 1

1
$\begingroup$

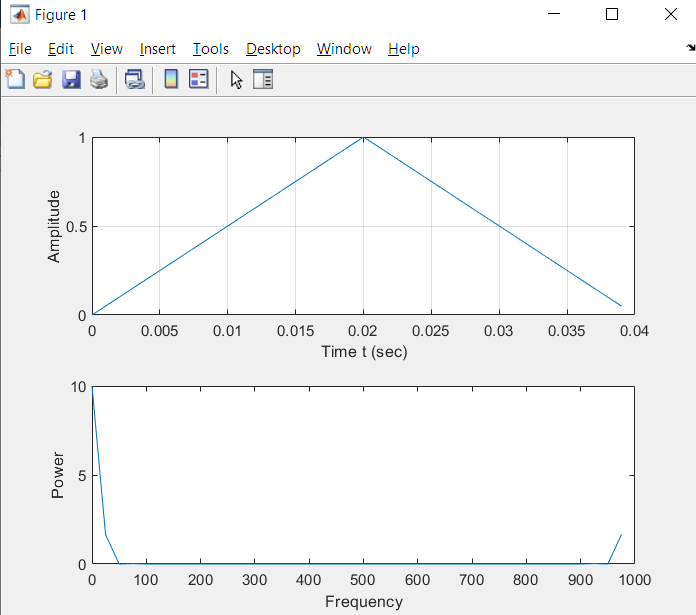
First, your period is $T = 1/25s=0.04s$ which means you do not need to take integral of 3 periods for getting fourier series. A plot of the DFT is given below when I took only first $T=0.04s$ is given by enter image description here

As you can see, all even multiples of $25\text{Hz}$ is zero, while odd multiples of $25\text{Hz}$ is decreasing with increasing frequency. From the plot $|X[5]|^2 = 0.002914$, while $|X[7]|^2=0.0008386$. Even multiples of $25\text{Hz}$ have very low values ($\lt 10^{-12}$). Taking DFT is not the correct method, so read on.

The above values are expected because fourier series of your even symmetric signal with non-zero DC has all $b_k =0$. For computing $a_k$, your signal $x(t)=2t/T$ for $0 \le t \le T/2$ and $x(t)=-2t/T-2$ for $T/2 \le t \le T$. I am not going into details of how to compute fourier series coefficients but I will give hints $$ a_0=\frac{2}{T}\int_0^T x(t)dt\\ a_k=\frac{2}{T}\int_0^T x(t)\cos(2\pi kt/T)dt \\ =\frac{2}{T}\int_0^{T/2} 2t/T\cos(2\pi kt/T)dt + \frac{2}{T}\int_{T/2}^T (-2t/T-2)\cos(2\pi kt/T)dt\\ =\frac{2((-1)^k-1)}{\pi^2k^2}\\ a_k=\frac{-4}{\pi^2k^2}\text{ for k odd}\\ a_k=0\text{ for k even} $$ So as you can see, the even harmonics are all zeros, while odd harmonics decrease by a factor of $1/k^2$. So $$a_5=\frac{-4}{\pi^2 25}\\ a_7=\frac{-4}{\pi^2 49} $$

$\endgroup$

Your Answer

By clicking “Post Your Answer”, you agree to our terms of service and acknowledge you have read our privacy policy.

Not the answer you're looking for? Browse other questions tagged or ask your own question.