0
$\begingroup$

I'm trying implement an IIR filter. I know the IIR filter come from that equation: equation
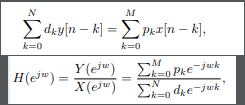
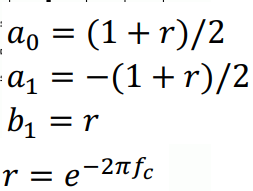
and i found that for high pass filter the coefficients are:

coe

where fc = cut freq.

here my matlab code:

fs = 1000;
fc=0.3;
r=exp(-2*pi*fc);
a = [(1+r)/2 -(1+r)/2];
b= [1 -r];
n = 0:1/(fs):20;
n1 = 1024;
x1 = cos(0.3*2*pi.*n);
x2 = cos(0.8*2*pi.*n);
%plot(n,x1);
%hold on
%plot(n,x2);
%hold on
%plot(n,x1+x2);
%aux = fft((x1+x2),n1);
%aux = aux(1:n1/2);
%f = (0:n1/2-1)*(fs/n1);
%length(f)
%legend('x1[n]','x2[n]','x1+x2')
%plot(f,abs(aux));
%hold on

y = filter([0.5759 -0.5759],[1 -0.1518] , x1+x2);
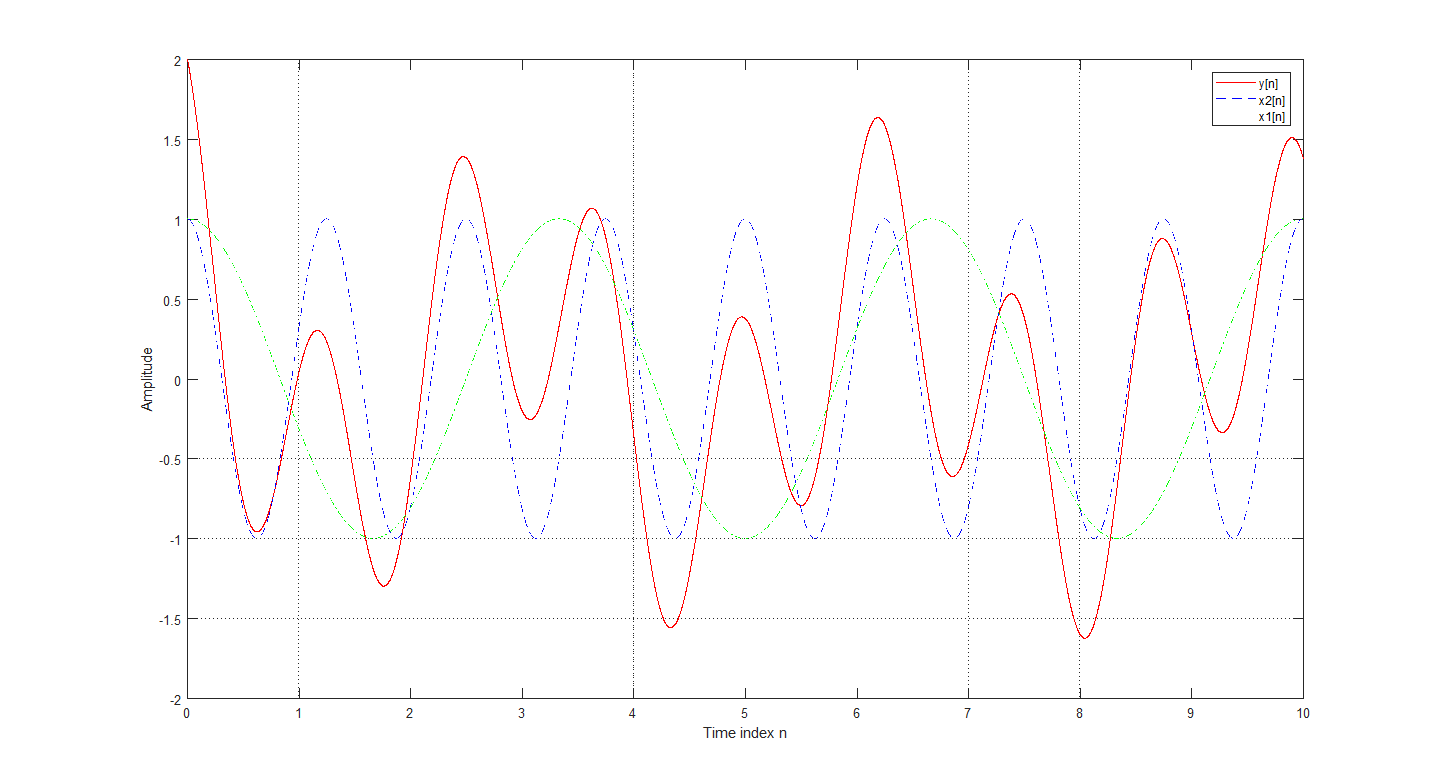
plot(n,y,'r-',n,x2,'b--',n,x1,'g-.');
grid
%axis([0 100 -1.2 4]);
ylabel('Amplitude');
xlabel('Time index n');
legend('y[n]','x2[n]','x1[n]')

the commented parts are from FFT part of program and it's working well but the filter function isn't working. Help me plz and sorry about my english.

$\endgroup$
1
  • $\begingroup$ if i find some time, i will convert your math picts into $\LaTeX$. that's the way we like it. and i think you need some consistency in the choice of symbols for coefficients. i would ditch $p_k$ and $d_k$ and replace with $a_k$ and $b_k$. $\endgroup$ Commented Nov 15, 2018 at 23:44

2 Answers 2

0
$\begingroup$

You have the following problems:

First your $a$ and $b$ seems to be mis-named; replace b with a and a with b. Where $b$ is the numerator coefficients of the filter and $a$ is the denominator coefficients. Also note that the filter command works like this y = filter(b,a,x)...

Then also your $f_c$ parameter is not (directly) controlling the $-3$ dB cutoff frequency (in Hz) of the high pass filter that you intend to obtain. But it's controlling th eradian per sample cutoff frequency. So you bettwe use teh notation wc for that instaed of fc.

In any case, your input signal frequencies are so low that they are killed by the filter and hence you see no output. Just increase their frequencies to see them at the output. Incidentally you can also decrease $f_c$ well below $0.3$ to get a tighter highpass (a DC-notch) filter..

Based on your comment, since you want a cutoff frequency in radians/sample $\omega_c$ instaed of a analog Hz frequency, then the parameter $f_c$ yields the correct discrete-time cutoff frequency. You can view the frequency response of your filter by the line figure,freqz(b,a) . So the only problem remains is that your signakl frequencies ar too low. replace it like so

x1 = cos(0.1*fs*pi*n);
x2 = cos(0.3*fs*pi*n);

note that in your code the index $n$ has a scale of $T_s$ so the frequencies should be scaled by $f_s$ to get normalized frqeuencies in the discrete-time frequency.

$\endgroup$
6
  • $\begingroup$ I put another post plz look at that and help-me plz '-' $\endgroup$ Commented Nov 16, 2018 at 0:15
  • $\begingroup$ ok edited the answer. $\endgroup$
    – Fat32
    Commented Nov 16, 2018 at 0:53
  • $\begingroup$ thank you man but it's really difficult for me.This thing don't work but thanks for your time $\endgroup$ Commented Nov 16, 2018 at 1:18
  • $\begingroup$ It just works... what is not working for you ? $\endgroup$
    – Fat32
    Commented Nov 16, 2018 at 9:54
  • $\begingroup$ I'm sorry, man. I saw you gave me a down vote. I understand. I not really know about all these things.You gave me a right answer and yet I was complaining. I'm really sorry. Sorry about my english again but a needed to use... $\endgroup$ Commented Nov 19, 2018 at 11:20
0
$\begingroup$

First your a and b seems to be mis-named; replace b with a and a with b. Where b is the numerator coefficients of the filter and a is the denominator coefficients. Also note that the filter command works like this y = filter(b,a,x)...

Now it's correct thanks.

In any case, your input signal frequencies are so low that they are killed by the filter and hence you see no output. Just increase their frequencies to see them at the output. Incidentally you can also decrease fc well below 0.3 to get a tighter highpass (a DC-notch) filter..

I put 0.0003 for fc and the graph looked like this: Graph

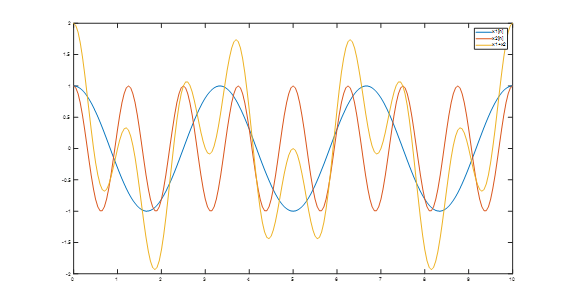
looks like the filter are cutting nothing because the plot of the two separete waves with sum are here: graph

Then also your fc parameter is not (directly) controlling the −3 dB cutoff frequency of the high pass filter that you intend to obtain.

I need to cut off the 0.3 rad/sample. I get the right answer with FIR filters but with IIR... i don't get it.

edit:

fs = 1000;
fc=0.3;
r=exp(-2*pi*fc);
a = [(1+r)/2 -(1+r)/2];
b= [1 -r];
n = 0:1/(fs):0.5;
n1 = 1024;
x1 = cos(0.1*fs*pi*n);
x2 = cos(0.3*fs*pi*n);
%plot(n,x1);
%hold on
%plot(n,x2);
%hold on
%plot(n,x1+x2);
%aux = fft((x1+x2),n1);
%aux = aux(1:n1/2);
f = (0:n1/2-1)*(2/n1);
%length(f)
%legend('x1[n]','x2[n]','x1+x2')
%plot(f,abs(aux));
%hold on

y = filter([0.5759 -0.5759],[1 -0.1518] , x1+x2);
plot(n,y,'r-',n,x2,'b--',n,x1,'g-.');
grid
ux = fft((y),n1);
ux = ux(1:n1/2);
plot(f,abs(ux));
%axis([0 100 -1.2 4]);
ylabel('Amplitude');
xlabel('Time index n');
legend('y[n]','x2[n]','x1[n]')

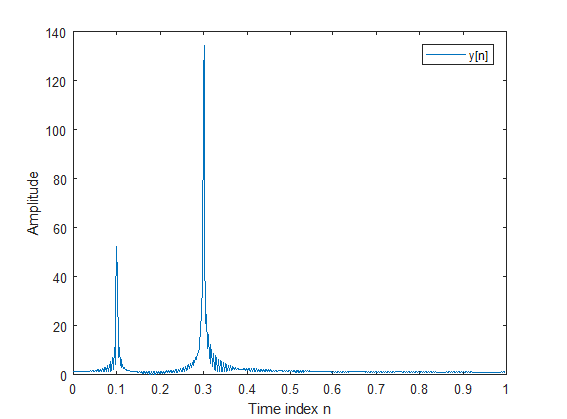
i put like u told and i normalized the f axes but here the FFT: graph

The wave of lowest freq remains. Thank you alot but i give it up.

$\endgroup$
0

Your Answer

By clicking “Post Your Answer”, you agree to our terms of service and acknowledge you have read our privacy policy.

Not the answer you're looking for? Browse other questions tagged or ask your own question.