2
$\begingroup$

I am trying to measure the similarity between two signals and I am using cross-correlation to achieve this.

Following the matlab example, I seem to have accomplished that, however, I do not understand the plot that I am getting. In the matlab example the explanation that is given is: The first subplot indicates that the signal and template 1 are less correlated while the high peak in the second subplot indicates that signal is present in the second template.

My question is how does the peak indicate that the signals have more in common? Shouldn't the two signals be more correlated when the distance between them is lower?

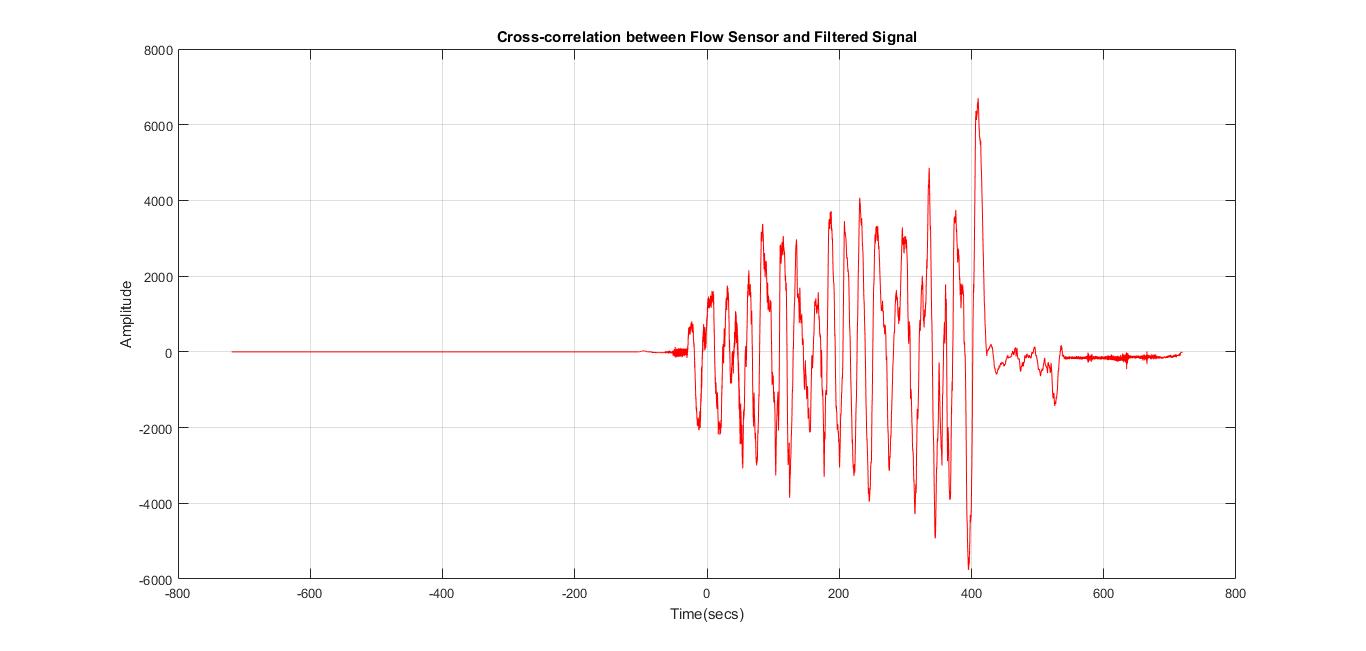
Moreover, when I tried it using my two signals I received the following image: enter image description here which looks more than strange compared to the image from the example, as I have multiple peaks and a relatively long straight line.

EDIT

I added two example signals that yield a relatively same result. As suggested from the comments, I tried without upsampling the signal and making them equal in length, however, the results weren't appealing as well. Furthermore, if the peak is, for example, at the 10s, does this indicate that the signals are simillar at the tenth second? What about if the peaks are in the negative time zone (t<0s)?

$\endgroup$
10
  • $\begingroup$ This is strange. You better put your code and data, for people to perform their own tests... $\endgroup$
    – Fat32
    Commented Aug 17, 2017 at 20:07
  • $\begingroup$ The code is basically the same as in the example with the only difference that I resample (upsample) one of the signals and slightly cut the other signal so that they are equal in length. I am not sure how to upload files to stackexchange, that is why I haven't done it. $\endgroup$
    – dsax7
    Commented Aug 18, 2017 at 21:35
  • $\begingroup$ The mathwork's example downsamples the higher rate signal. And you don't need to cut the signal length. Try it thiw way ? $\endgroup$
    – Fat32
    Commented Aug 19, 2017 at 10:41
  • $\begingroup$ @Fat32 Please see the edit of the post. $\endgroup$
    – dsax7
    Commented Aug 20, 2017 at 10:02
  • 1
    $\begingroup$ I performed the xcorr operations on upsampled-signal2 and signal1, and got a result incomparable to yours. In my testing, signal_2 does not exist in signal_1 (or SNR is so low that it can not be reliably detected). I'm looking from a matched filter detection point of view. If signal1 contains a copy of signal2 in it, then the peak of Xcorr determines its position. In this case there are multiple peaks indicating either a low SNR or non-existing signal2. $\endgroup$
    – Fat32
    Commented Aug 20, 2017 at 11:05

1 Answer 1

3
$\begingroup$

xcorr function (of Matlab) computes the cross-correlation between two sequences $x[n]$ and $y[n]$ of length $M$ each. If $x$ and $y$ are random processes (jointly WSS) then xcorr returns an estimate $$\hat{r}_{xy}[m] = \frac{1}{M} \sum_{n=0}^{M-1} x[n]y[n+m]^*$$ computed over the two random vectors $x$ and $y$, of the theoretical cross-correlation between the two random processes $X$ and $Y$: $$r_{xy} [m] = E\{ X[n]Y[n+m]^* \} $$ (Note that the practical estimate computation (the sum's range and the scale) may be modified to make it an unbiased estimator and to deal with out of bound entries...)

When the two sequences belong to deterministic signals, then it's called as the deterministic cross-correlation, essentially the same thing computed from a practical point of view, but its interpretation is made carefully depending on the case.

In signal processing theory and signal detection theory, the operations of correlation, convolution and matched filtering merge at some point. Without further details, one can observe that given two sequences $x$ and $y$, the the computation mechanics and hence the results of the three operations, will be the same (with slight modifications in the orientation of the arguments)

Matched filtering, essentially convolves a test signal with a target signal, with the test signal reversed in time. It can be shown that there'll be a unique peak at the matched filter output, if the target signal involves a copy of the test signal inside. From a theoretical point of view, intuition tells that, if the target and test signals are uncorrelated (and orthogonal, for zero mean processes, as a result) their cross-correlations should produce low values in line with inner products between orthogonal vectors. But when the target signal involves a copy of the test signal at some point, then there will be high correlation between the target and test signals close to those shifts, at the output, that will create the peak.

There are subtle details, however, such as if the test signal is contained more than once, if several test signals overlapp, and if the test signal is not contained purely but through some (inevitable) transformations, which make the comparison more difficult or less reliable unless those transformations are known and rolled back properly.

In most practical scenarios, the target signal will consist of noise or irrelevant signals plus the test signal. And for those lags which compare the test signal with the noise portions, the output will be arbitrary (in the ideal case of when the noise belongs to a zero mean white random process, the output should tend to zero, as the summation would sequentially add and subtract test signal samples which would produce apprx a zero, when the test signal belongs to a zero mean (ergodic) process). And when the comparison is between target signal and test signal for a lag that corresponds to the place of the test signal in the target signal, the computation should produce a large value, as the sum is essentially computing the energy of the test signal; i.i, sum of $x[n]^2$ values.

Note that when the SNR is low; that the noise portions have large amplitudes compared to the test signal embedded in the target signal, then the above paragraph becomes invalidated and the expected peak is burried within random peaks produced as the result of the irrelevant computations between the test signals and noise contained in the target signal.
$\endgroup$
7
  • $\begingroup$ Great answer! This really cleared up some questions. However, I am still wondering, would it make difference if I use the RMS envelopes of the two signals for the cross correlation? $\endgroup$
    – dsax7
    Commented Aug 20, 2017 at 16:12
  • $\begingroup$ yes you can use enlevopes instead of the signal itself for the correlation analysis but then you would be looking for a different kind of similarity other than waveform matching, which is the core concept of correlation. Note that different signals at different frequencies can have the same (or similar) envelopes. $\endgroup$
    – Fat32
    Commented Aug 20, 2017 at 16:57
  • $\begingroup$ Note that the envelope will be non-zero mean. It will have consequences... $\endgroup$
    – Fat32
    Commented Aug 20, 2017 at 18:19
  • $\begingroup$ Why would it have consequences when it is zero mean? If the cross correlation is not a viable way to measure similarities in the two signals, how should I then achieve this? With coherence analysis? $\endgroup$
    – dsax7
    Commented Aug 20, 2017 at 19:12
  • $\begingroup$ An envelope signal is always positive (nonnegative) hence its mean cannot be zero, therefore when computing the correlations this will affect the result. Or you could subctract the mean before processing. I cannot tell much about coherence analysis. Correlation is the most important tool to decide on similarities between two signals. I don't know why you don't want to use it. As I said, I cannot say much about coherence analysis. It's up to you then. $\endgroup$
    – Fat32
    Commented Aug 20, 2017 at 21:11

Your Answer

By clicking “Post Your Answer”, you agree to our terms of service and acknowledge you have read our privacy policy.

Not the answer you're looking for? Browse other questions tagged or ask your own question.