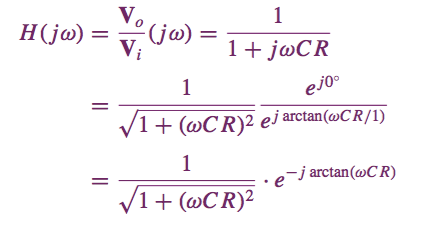
$H(j\omega)$ comes from the more general response $H(s)$ which comes from the Laplace transform using the complex unit s which has real and imaginary components given as $$s= \sigma+j\omega$$
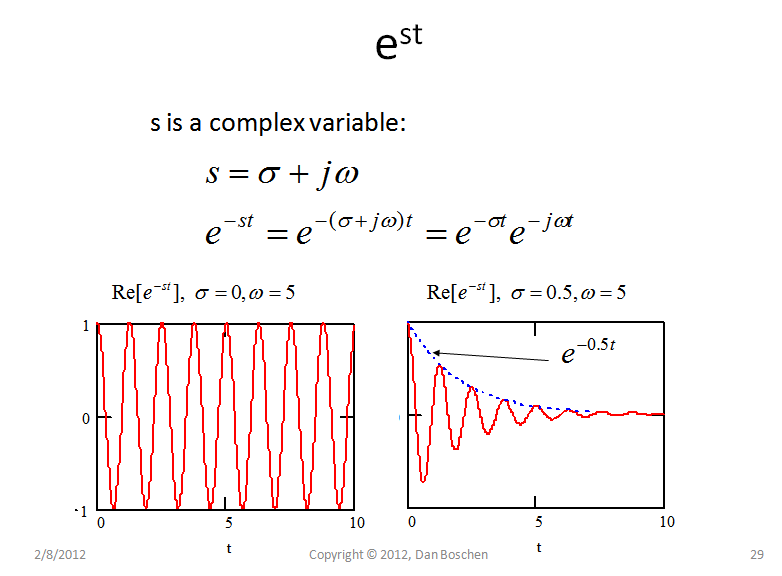
This may be too much to swallow if you haven't been exposed to the Laplace Transform yet, but let me make an attempt to simplify it: The Laplace transform decomposes analytic single valued functions into a continuous function of s by correlating the function with all values of $e^{st}$ If you are asking about j you are probably equally confused about $e^{st}$. Note that $Ae^{j\theta}$ is simply a function with magnitude A and angle $\theta$, so if s is only imaginary ($s=j\omega$), then $e^{st}=e^{j\omega}$ and the result is a function whos phase is changing with time. I like to view it as a phasor (vector) of constant magnitude rotating around the complex plane, thus we see that the real part of this is a cosine wave and the imaginary part is a sine wave resulting in Euler's Identity $e^{j\omega}= cos(\omega)+jsin(\omega)$. When s has real components ($\sigma$) then the time domain function also decays or grows depending on the sign of $\sigma$. See the plot below demonstrating this:
Now to relate this to a low pass filter see this next plot below. This shows the surface plot of H(s) for a low pass filter with two poles in the left half plane:
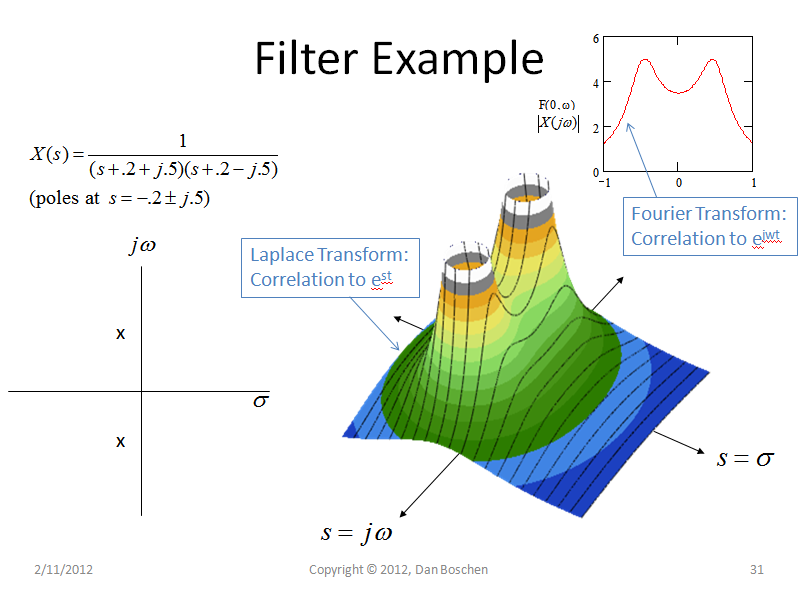
The frequency response is H(s) when we restrict s to just be imaginary such that $s=e^{j\omega}$, therefore we are seeing the result when we only apply fixed magnitude sine and cosine waves to the input of the filter, omitting all the cases where the input signal may decay or grow- which makes sense when we want to measure the frequency response: apply a fixed frequency at the input and measure how much this one frequency has been attenuated at the output (magnitude response), and how much the signal has shifted in phase (phase response). And repeat this for every frequency (which just means sweep s along the $j\omega$ axis from $-\infty$ to $+\infty$. This is in fact the Fourier Transform as indicated in the plot above showing an expected response for a low pass filter (in this case one that has peaking near the resonance points based on the pole locations.
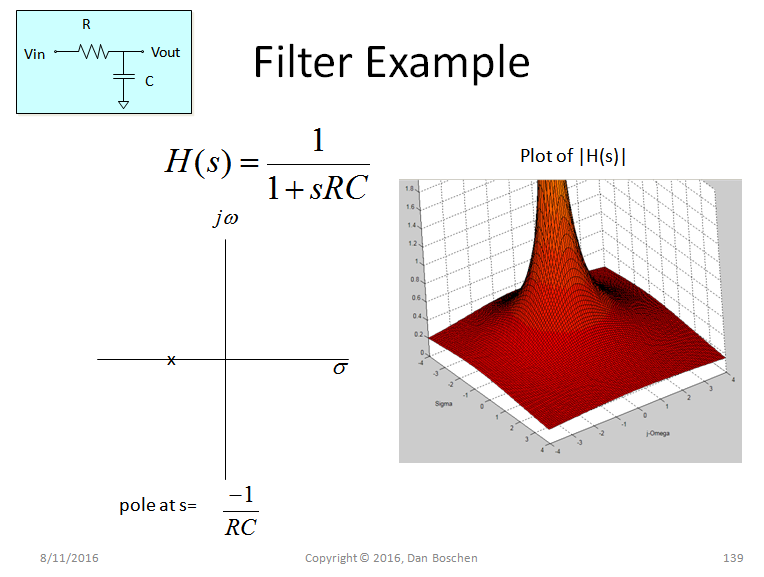
Here is another example very close to yours but showing the same relationship of H(s) and $H(j\omega)$
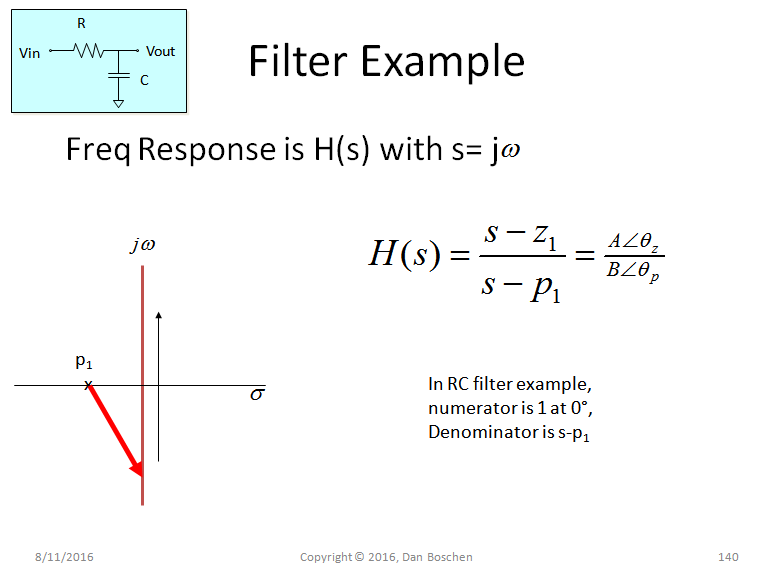
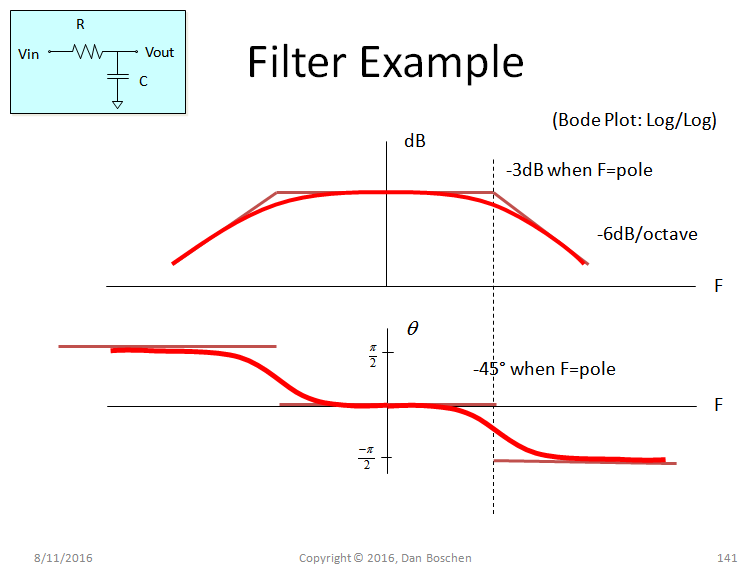
And finally the Bode Plot showing the magnitude and phase versus frequency for this low pass filter, which is specifically the magnitude and phase of H(s) when $s=j\omega$ or otherwise stated more directly as $H(j\omega)$. Electrically what is happening is the capacitor becomes a smaller and smaller impedance as the frequency increases ($X_c = \frac{1}{2\pi fC}$). This capacitor is in parallel with what is typically a resistive load. At low frequencies, DC for example, the capacitor is an infinite impedance or open circuit, as if it is not even there and the voltage at the load will simply be $V_{in}\frac{R_L}{R+R_L}$ but as the frequency increases the output will be $V_{}in\frac{R_L||X_C}{R+R_L||X_C}$ where $||$ represents the parallel combination of the two impedances. What we see from this is that the voltage at the load will decrease as the frequency increases (low pass filter). At high frequencies (RF and microwave) we deal more with reflection coefficients in that the high frequencies are actually reflected back to the source, but I won't get into that here.
 ?
? 