1
$\begingroup$

I have recorded a signal, which I know is periodic (apart from noise). The period length is unknown. I want to extract the last period from the signal. Before going to a noisy signal, I first tested the method on a self-created noiseless signal. I've read that the autocorrolation is the way to do this, but it did not work for my example. Let me show you what I have done.

First I created a periodic signal of 1000 samples with the Matlab code below:

N_period = 1000;
start_time = 0;
end_time = 1;
dt = (end_time-start_time)/N_period; 
fs = 1/dt; %sample frequency
t = start_time:dt:end_time-dt;
y_period = sin(2*pi*t);

I then extended the signal in order to be longer than one period, but smaller than 2 periods:

y = [y_period(0.7*N_period:N_period), y_period];

I know, by construction, that I need to get the last 1000 samples to extract the last period out of the signal.

I first pad the signal with zeros, and then apply the autocorrelation

y_cor = [zeros(1,N), y, zeros(1,N)];
[autocor, lags] = xcorr(y_cor);
figure;
plot(lags, autocor)
grid

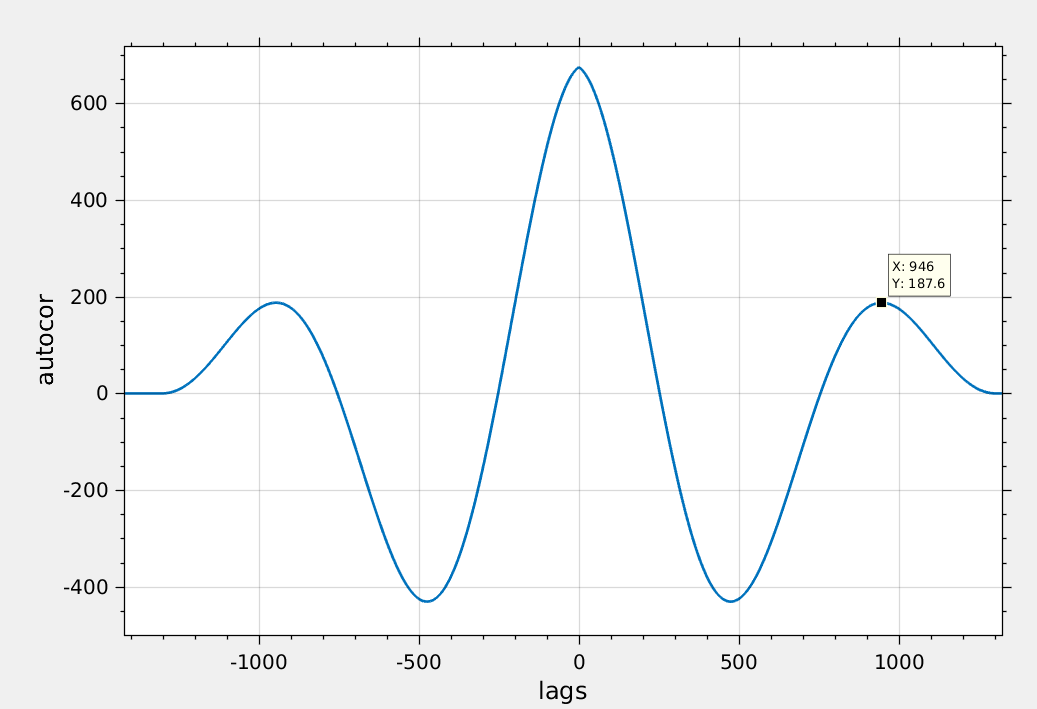
As can be seen in the figure below, the second largest peak appears at lag=946 and not at lag=1000.

enter image description here

If the method does not work for a noiseless signal, how can it then work on a noisy signal? Did I do something wrong? How can I improve this?

$\endgroup$
2
  • 1
    $\begingroup$ you need more cycles of your periodic waveform in your window for this padded autocorrelation to work. and you should be aware of the attenuation of the peaks as the portion of the two windows is less as the lag increases. $\endgroup$ Commented Jan 31, 2017 at 19:17
  • 1
    $\begingroup$ Actually, I believe the peak is before 1000, because at this point in time, more non-zero samples overlap and hence the value is higher. At 1000, even though the samples are perfectly aligned, only fewer samples overlap, leading to a smaller autocorrelation value. Hence, one solution could be to not use the autocorrelation as returned by matlab, but divide each point by the number of non-zero overlapped samples (i.e. contributing samples). $\endgroup$ Commented Jan 31, 2017 at 20:17

1 Answer 1

1
$\begingroup$

Actually, implementing my suggestion in the comment leads to a better solution:

N_period = 1000;
start_time = 0;
end_time = 1;
dt = (end_time-start_time)/N_period; 
fs = 1/dt; %sample frequency
t = start_time:dt:end_time-dt;
y_period = sin(2*pi*t);

y = [y_period(0.7*N_period:N_period), y_period];

[autocor, lags] = xcorr(y);
figure(1);
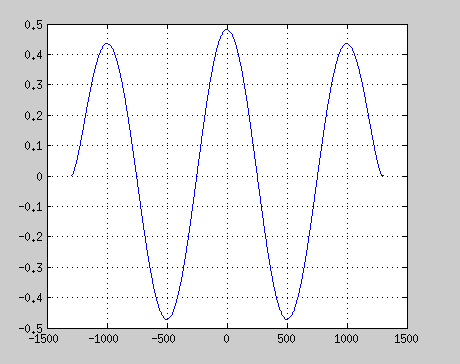
plot(lags, autocor ./ (100+length(y) - abs(lags)))
grid

enter image description here

I only calculate the autocorrelation of y without the zero-padding (y_cor) (actually, it does not really matter). As you see, if you divide the autocorrelation by the number of overlapped samples, you get a better result. However, it is not perfect, I've added an (arbitrary) constant 100 to the division to account for boundary effects.

$\endgroup$
2
  • $\begingroup$ You're not using y_cor in your code; is that intentional? $\endgroup$
    – MBaz
    Commented Jan 31, 2017 at 22:27
  • $\begingroup$ correct, that's what I wanted to describe in my text below the figure. I've made it more explicite. $\endgroup$ Commented Feb 1, 2017 at 5:33

Your Answer

By clicking “Post Your Answer”, you agree to our terms of service and acknowledge you have read our privacy policy.

Not the answer you're looking for? Browse other questions tagged or ask your own question.