1
$\begingroup$

I have a number of values retrieved from a sampled signal that is generated randomly for no specific purpose.

The task I am presented with (Quoted below):

calculate the frequency of the highest amplitude wave in each file. Each wave is of fixed frequency.

I was asked to calculate the frequency of each wave. How could I do this?

Each file contains values of a sampled signal:

Seconds,Volts
0, 0
5.096646E-09, 0.02255292
1.019329E-08, 0.04508986
1.528994E-08, 0.06759485
2.038658E-08, 0.09005192
2.548323E-08, 0.1124452
3.057988E-08, 0.1347587
3.567652E-08, 0.1569767
4.077317E-08, 0.1790835
4.586981E-08, 0.2010633
5.096646E-08, 0.2229007
5.60631E-08, 0.24458
6.115975E-08, 0.266086
6.62564E-08, 0.2874034
7.135304E-08, 0.3085171
7.644969E-08, 0.3294121
8.154633E-08, 0.3500737
8.664298E-08, 0.3704871
9.173962E-08, 0.3906379
9.683627E-08, 0.4105118
1.019329E-07, 0.4300948
1.070296E-07, 0.449373
1.121262E-07, 0.4683326
1.172229E-07, 0.4869603
1.223195E-07, 0.5052429
1.274161E-07, 0.5231673
1.325128E-07, 0.5407209
1.376094E-07, 0.5578913
1.427061E-07, 0.5746663
1.478027E-07, 0.5910339
1.528994E-07, 0.6069826
1.57996E-07, 0.6225011

The signal goes on and on...

This is all the information I have been provided for this task.

$\endgroup$
10
  • $\begingroup$ The waves are sinusoidals ? $\endgroup$
    – Fat32
    Commented May 25, 2016 at 15:29
  • $\begingroup$ @Fat32, based on the sampled values, no! because different waves have different peaks, $\endgroup$
    – Aboudi
    Commented May 25, 2016 at 15:42
  • $\begingroup$ I have looked at your provided data (of 56 samples) and its a single sine wave? what do you mean different waves having different peaks? $\endgroup$
    – Fat32
    Commented May 25, 2016 at 15:57
  • $\begingroup$ @Fat32, sorry my bad, I had the wrong understanding of what a sine wave was! $\endgroup$
    – Aboudi
    Commented May 25, 2016 at 16:06
  • $\begingroup$ You are looking for a discrete fourier transform. $\endgroup$
    – The Dude
    Commented May 25, 2016 at 16:24

2 Answers 2

2
$\begingroup$

Knowing the Common Tools Used to Determine Frequency Content

In order to find the frequency of the highest amplitude wave in your signal you will need to perform a Fourier Transform. Or, more likely, a Fast Fourier Transform since it is the more computationally efficient version of the Fourier Transform, designed for computers that have a finite amount of memory to work with.

I highly suggest familiarizing yourself with the utility of the Fourier Transform before just calculating and plotting it through Matlab's fft function or something else like that. You should read this beautiful explanation of the Fourier Transform and it's importance / application in signal processing.

Compute the Frequency Representation of Your Signal

You should refer to answer @PeterK left to figure out how to compute the FFT of your signal data in R. If you have access to Matlab, I would recommend exploring the use of its fft function.

Understanding the Frequency Representation of Your Signal

If you are having trouble understanding the results of the FFT plot that you see upon output, you can refer to this helpful answer from StackOverflow.

In your particular case, the signal data you provided is a sampled sinusoidal wave. A continuous sinusoidal wave has one fundamental frequency (as in, it oscillates at one given frequency forever, always oscillating at that same rate). Once you perform an FFT on your signal data, you'll see peaks in the FFT plot. Those peaks in the frequency content of your signal indicate dominant frequencies in your input signal. A truly continuous sinusoid (your signal is sinusoid, but not continuous) would only have two peaks in the frequency domain. One peak would be located at its fundamental frequency and the other peak would be at the negative of the fundamental frequency. Because your sampled signal isn't continuous, you're liable to see other auxiliary peaks in your FFT plot, but the highest peaks will still correspond to the positive & negative of your signal's fundamental frequency.

I hope this explanation helps. Good luck!

$\endgroup$
2
$\begingroup$

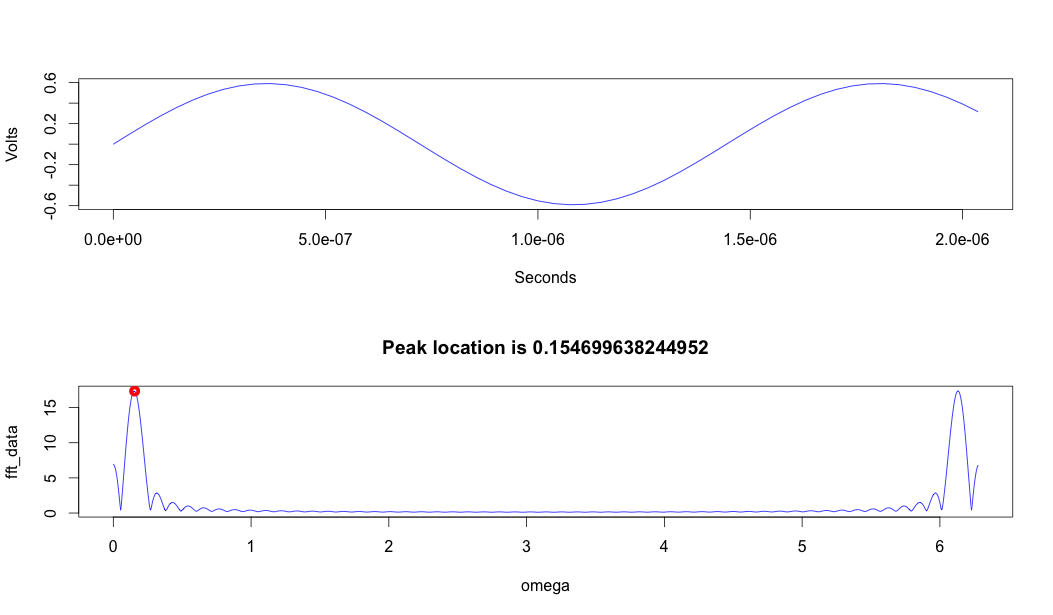
This shows the subset of the data you included and the absolute value of the DFT (discrete Fourier transform) of a zero-padded version of it.

Plotted data and DFT


R Code Below #Q31040

data <- read.csv('Q31040/data.csv')

par(mfrow=c(2,1))
plot(data, type='l', col="blue")

zero_padded_data <- c(data$Volts, rep(0,1000))

omega <- seq(0,2*pi - 2*pi/length(zero_padded_data),2*pi/length(zero_padded_data))
fft_data <- abs(fft(zero_padded_data))
plot(omega, fft_data, type='l', col="blue")

peak <- which.max(fft_data)
points(omega[peak], fft_data[peak], col="red", lwd = 5)
title(paste("Peak location is", omega[peak]))
$\endgroup$

Your Answer

By clicking “Post Your Answer”, you agree to our terms of service and acknowledge you have read our privacy policy.

Not the answer you're looking for? Browse other questions tagged or ask your own question.