0
$\begingroup$

Sawtooth Wave

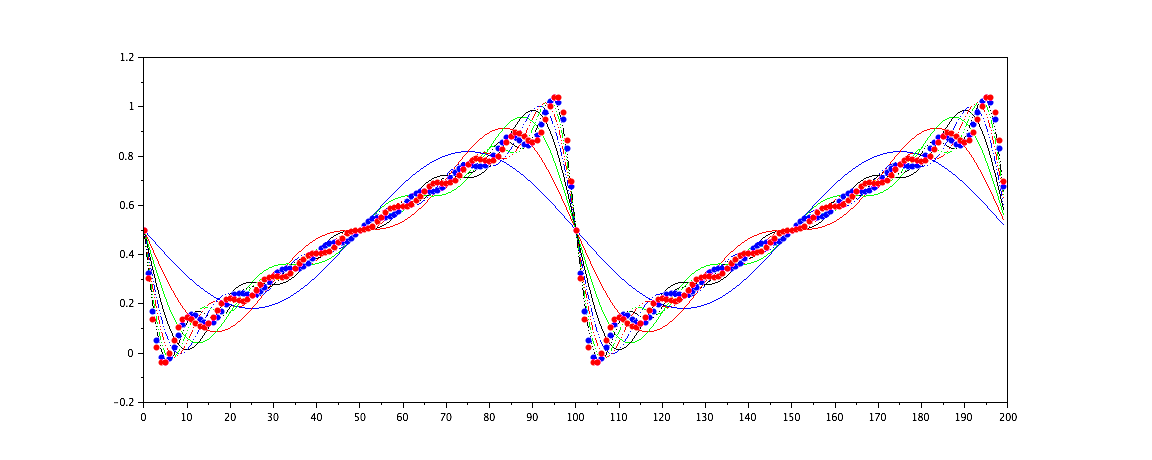
Hi all, I've been trying to zero centre a waveform prior to IFFT. my recent attempts are based on the following code which is producing the waveform below. I don't understand why this isn't working or why there are notches in the sawtooth wave. Is my math incorrect?

The following code snippet is used to center it.

zeroStartRadianValue = 2*PI*f0/fs*NFFT*0.50*-1.0;
$\endgroup$
4
  • $\begingroup$ You will need to give more information: What is the above plot of? How was it generated? There appear to be two graphs there? What are they? $\endgroup$
    – Peter K.
    Commented Sep 11, 2015 at 2:02
  • $\begingroup$ The Plot is the left and right channel of the synthesized signal. The signal is a sawtooth waveform. The spectrum was generating by analysing a near perfect (mathematical) sawtooth audio clip, analysing it to extract out the harmonic mags and phases and then resynthesizing it via an IFFT using the extracted spectrum centering the start phase using the above line of code. The artifacts in the waveform are the 'teeth' in the descending slope. I'm wondering if these teeth are caused by an incorrect calculation in the above code. $\endgroup$
    – cixelsyd
    Commented Sep 11, 2015 at 2:27
  • $\begingroup$ The code you posted does nothing but compute a value. If you have some artifact creeping in then in is certainly in the code in which you are doing something with the value. Without sharing more about that process nobody is going to be able to help you. $\endgroup$
    – jaket
    Commented Sep 11, 2015 at 6:22
  • 3
    $\begingroup$ For me it looks perfectly ok. That's what sawtooth wave without aliasing looks like. $\endgroup$
    – jojeck
    Commented Sep 11, 2015 at 8:35

1 Answer 1

3
$\begingroup$

As @jojek says, this looks precisely correct. It's like Gibbs phenomenon, but for a sawtooth.

The wikipedia page for the sawtooth has this way to write a sawtooth:

$$ x(t) = \frac{A}{2} - \frac{A}{\pi} \sum_{k=1}^{\infty} \frac{\sin(2\pi k f t)}{k} $$

which yields the image below, showing gradual convergence over summing the first 10 terms.

enter image description here

If I just use 64 terms, then this is what I get:

enter image description here

Scilab code is below.

// 25750
// https://en.wikipedia.org/wiki/Sawtooth_wave
clf
f = 0.01;
N = 200;
t = [0:N-1];
A = 1;
graphs = ["","r","g","k",":","r:","g:","k:",".","r.","g.","k.",]
idx = 1;
for h=1:10,
    x = A/2*ones(1,N);
    for k=1:h,
        x = x - A/%pi * sin(2*%pi*k*f*t)/k;
    end 
    plot(t,x,graphs(idx))
    idx = idx + 1;
end
$\endgroup$
3
  • $\begingroup$ Thanks for the responses. I was expecting something smoother in my waveform as I'm using 64 terms. $\endgroup$
    – cixelsyd
    Commented Sep 11, 2015 at 19:47
  • $\begingroup$ @cixelsyd : Same problem: you need MANY more than 64 to accurately represent any waveform with discontinuities in it. $\endgroup$
    – Peter K.
    Commented Sep 11, 2015 at 20:13
  • 1
    $\begingroup$ Thanks Peter. and thanks for the scilab plots and code. I've been struggling with Octave and scilab looks like it could be a good alternative. Again thanks for the code and the plot. $\endgroup$
    – cixelsyd
    Commented Sep 11, 2015 at 22:33

Your Answer

By clicking “Post Your Answer”, you agree to our terms of service and acknowledge you have read our privacy policy.

Not the answer you're looking for? Browse other questions tagged or ask your own question.