Added 64-term picture
Source Link
Peter K.
  • 26k
  • 9
  • 47
  • 93

As @jojek says, this looks precisely correct. It's like Gibbs phenomenon, but for a sawtooth.

The wikipedia page for the sawtooth has this way to write a sawtooth:

$$ x(t) = \frac{A}{2} - \frac{A}{\pi} \sum_{k=1}^{\infty} \frac{\sin(2\pi k f t)}{k} $$

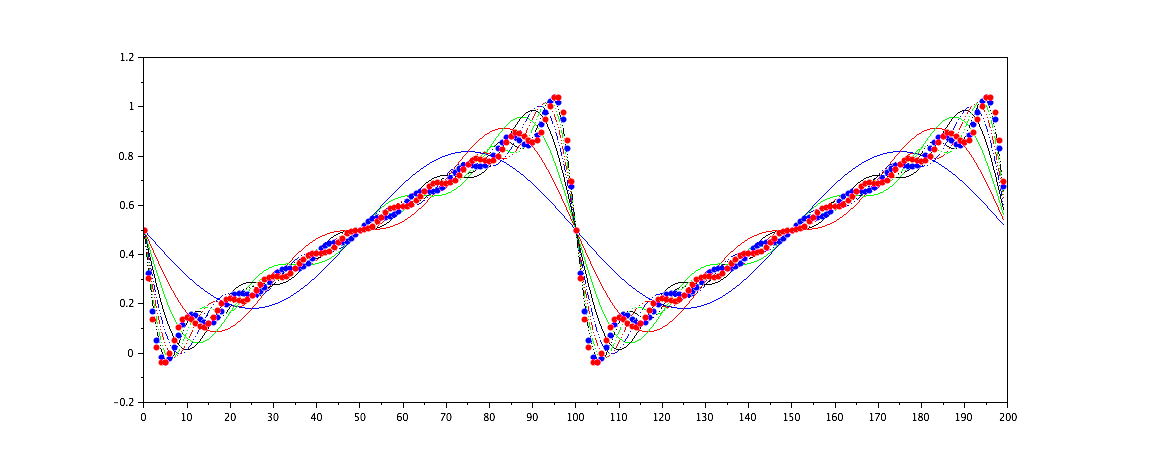
which yields the image below, showing gradual convergence over summing the first 10 terms.

enter image description here

If I just use 64 terms, then this is what I get:

enter image description here

Scilab code is below.

// 25750
// https://en.wikipedia.org/wiki/Sawtooth_wave
clf
f = 0.01;
N = 200;
t = [0:N-1];
A = 1;
graphs = ["","r","g","k",":","r:","g:","k:",".","r.","g.","k.",]
idx = 1;
for h=1:10,
    x = A/2*ones(1,N);
    for k=1:h,
        x = x - A/%pi * sin(2*%pi*k*f*t)/k;
    end 
    plot(t,x,graphs(idx))
    idx = idx + 1;
end

As @jojek says, this looks precisely correct. It's like Gibbs phenomenon, but for a sawtooth.

The wikipedia page for the sawtooth has this way to write a sawtooth:

$$ x(t) = \frac{A}{2} - \frac{A}{\pi} \sum_{k=1}^{\infty} \frac{\sin(2\pi k f t)}{k} $$

which yields the image below, showing gradual convergence over summing the first 10 terms.

enter image description here

Scilab code is below.

// 25750
// https://en.wikipedia.org/wiki/Sawtooth_wave
clf
f = 0.01;
N = 200;
t = [0:N-1];
A = 1;
graphs = ["","r","g","k",":","r:","g:","k:",".","r.","g.","k.",]
idx = 1;
for h=1:10,
    x = A/2*ones(1,N);
    for k=1:h,
        x = x - A/%pi * sin(2*%pi*k*f*t)/k;
    end 
    plot(t,x,graphs(idx))
    idx = idx + 1;
end
As @jojek says, this looks precisely correct. It's like Gibbs phenomenon, but for a sawtooth.

The wikipedia page for the sawtooth has this way to write a sawtooth:

$$ x(t) = \frac{A}{2} - \frac{A}{\pi} \sum_{k=1}^{\infty} \frac{\sin(2\pi k f t)}{k} $$

which yields the image below, showing gradual convergence over summing the first 10 terms.

enter image description here

If I just use 64 terms, then this is what I get:

enter image description here

Scilab code is below.

// 25750
// https://en.wikipedia.org/wiki/Sawtooth_wave
clf
f = 0.01;
N = 200;
t = [0:N-1];
A = 1;
graphs = ["","r","g","k",":","r:","g:","k:",".","r.","g.","k.",]
idx = 1;
for h=1:10,
    x = A/2*ones(1,N);
    for k=1:h,
        x = x - A/%pi * sin(2*%pi*k*f*t)/k;
    end 
    plot(t,x,graphs(idx))
    idx = idx + 1;
end
Source Link
Peter K.
  • 26k
  • 9
  • 47
  • 93

As @jojek says, this looks precisely correct. It's like Gibbs phenomenon, but for a sawtooth.

The wikipedia page for the sawtooth has this way to write a sawtooth:

$$ x(t) = \frac{A}{2} - \frac{A}{\pi} \sum_{k=1}^{\infty} \frac{\sin(2\pi k f t)}{k} $$

which yields the image below, showing gradual convergence over summing the first 10 terms.

enter image description here

Scilab code is below.

// 25750
// https://en.wikipedia.org/wiki/Sawtooth_wave
clf
f = 0.01;
N = 200;
t = [0:N-1];
A = 1;
graphs = ["","r","g","k",":","r:","g:","k:",".","r.","g.","k.",]
idx = 1;
for h=1:10,
    x = A/2*ones(1,N);
    for k=1:h,
        x = x - A/%pi * sin(2*%pi*k*f*t)/k;
    end 
    plot(t,x,graphs(idx))
    idx = idx + 1;
end