3
$\begingroup$

I wanted to verify the fact that main lobe width of a Hann/Hamming window is twice that of a rectangular window, using Matlab. I computed the analytical expressions for the respective frequency responses, and plotted them. I do not get the expected result. Can someone explain this?

Code :

omega = -pi:0.01:pi;
N = 20;
fn = exp(-j*omega*(N/2 - 0.5)).*((sin(omega*N/2))./(sin(omega/2)));
shift = (length(omega)-1)/(N-1); % 2pi/(N-1); length(omega) = 2*pi
fn2 = 0.54*fn' + 0.23*circshift(fn',ceil(shift)) + 0.23*circshift(fn',-ceil(shift));
plot(abs(fn)/max(abs(fn)))
hold on
plot(abs(fn2)/max(abs(fn2)),'r')

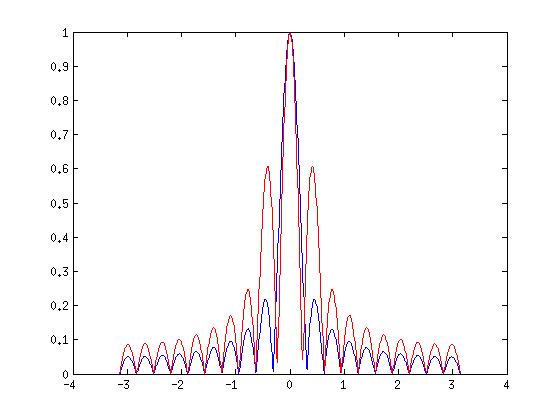
This is the plot :

enter image description here

As you can see, neither is the main lobe wider, nor are the side lobes smaller.

$\endgroup$

2 Answers 2

4
$\begingroup$

The problem is the way you shift the transform of the rectangular window to compute the transform of the Hamming window. You can't just shift on the discrete frequency grid, but you have to evaluate the (continuously) shifted functions on the grid. If $W_r(\omega)$ is the transform of the rectangular window

$$W_r(\omega)=\frac{1}{N}e^{-j\omega (N-1)/2}\frac{\sin(N\omega /2)}{\sin(\omega/2)}\tag{1}$$

then the transform of the Hamming window can be written as

$$W_h(\omega)=\alpha W(\omega)-\frac{\beta}{2}\left[W_r(\omega-\omega_0)+W_r(\omega+\omega_0)\right]$$

with $\alpha=0.54$, $\beta=0.46$, and $\omega_0=2\pi/(N-1)$.

In Matlab/Octave you get:

w = -pi:0.01:pi;
N = 20;
w0 = 2*pi/(N-1);
Wr = 1/N*exp(-j*w*(N-1)/2).*sin(N*w/2)./sin(w/2);
W1 = 1/N*exp(-j*(w-w0)*(N-1)/2).*sin(N*(w-w0)/2)./sin((w-w0)/2);
W2 = 1/N*exp(-j*(w+w0)*(N-1)/2).*sin(N*(w+w0)/2)./sin((w+w0)/2);
Wh = .54*Wr -.23*(W1+W2);

plot(w/pi,20*log10(abs(Wr)),w/pi,20*log10(abs(Wh)/max(abs(Wh))))
axis([-1,1,-60,0]), grid
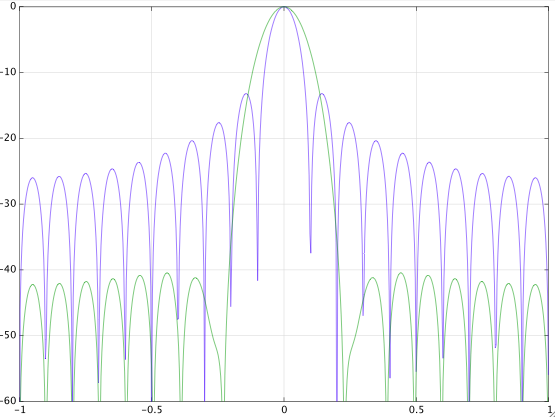
enter image description here

EDIT:

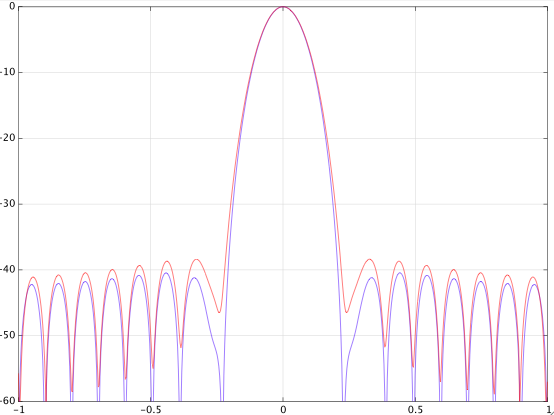
Another error I've mentioned in the comments is the sign of the shifted windows in your formula. The positive sign that you use is valid for a zero-phase Hamming window, i.e. a window that is centered at $n=0$. However, your rectangular window starts at $n=0$, so it's not a zero-phase window. Consequently, combining the two windows as if they were both zero-phase doesn't work. That's where the negative sign in my formula comes from (both windows start at $n=0$). If you change the sign in your code the result is much closer to a Hamming window than before, but it's still off due to the shift on the grid I've mentioned above. In the figure below you can see the difference (blue: exact Hamming; red: your solution with corrected sign): enter image description here
$\endgroup$
4
  • $\begingroup$ Isn't the expression for Wh = 0.54Wr + 0.23(W1 + W2)? I have derived this myself, and a source : dsprelated.com/dspbooks/sasp/… Strangely, modifying the expression in my code gives the expected result. $\endgroup$ Commented Mar 26, 2015 at 4:18
  • $\begingroup$ @ManojKumar: The formula you're referring to is a zero-phase window, i.e. a window centered at $n=0$. But the rectangular window you're using is not zero-phase, but it starts at $n=0$. So combining the two doesn't work. Note that even if you exchange the sign in your formula, you just get an approximation of the Hamming window. You can see this by looking at the zeros in the frequency domain. They are much deeper for the correct window. Your result is not exact because you shift on the grid, i.e. your shift is quantized. $\endgroup$
    – Matt L.
    Commented Mar 26, 2015 at 8:10
  • $\begingroup$ @ManojKumar I've added a plot to my answer to show you the difference between the exact window and yours (with corrected sign) with quantized shifts. $\endgroup$
    – Matt L.
    Commented Mar 26, 2015 at 8:21
  • $\begingroup$ Thank you very much! Initially I had a bit of trouble understanding why does the sign reverse for a shifted window. Here is a source in case anyone finds it useful - katjaas.nl/FFTwindow/FFTwindow.html $\endgroup$ Commented Mar 26, 2015 at 17:57
3
$\begingroup$

I think your analytical expressions for the frequency response of the windows have an error.

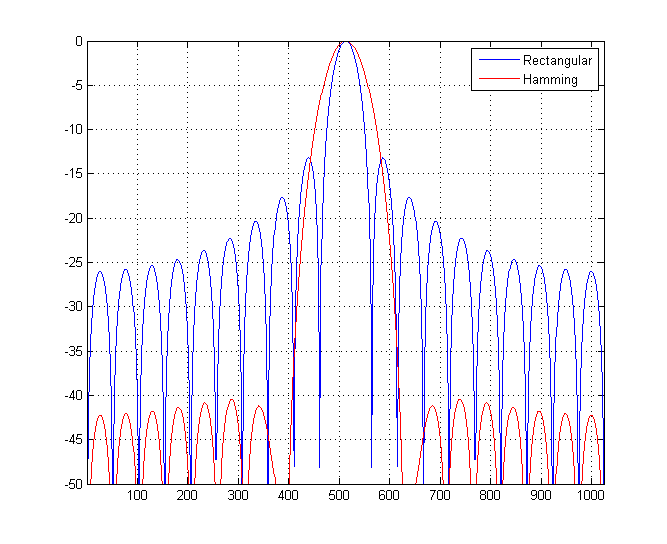
Another way to do the comparison is to create the windows in the time domain and take an FFT.

x1 = ones(20,1);  % rectangular window
x2 = hamming(20); % hamming window

% normalize
x1 = x1 / sum(x1);
x2 = x2 / sum(x2);

X1 = mag2db(abs(fftshift(fft(x1,1024))));
X2 = mag2db(abs(fftshift(fft(x2,1024))));

plot(X1)
hold on; grid on
plot(X2,'r')
legend('Rectangular','Hamming')
ylim([-50 0])
xlim([1 1024])

enter image description here

$\endgroup$
1
  • $\begingroup$ Thanks! But I was looking to verify the analytical expressions.. $\endgroup$ Commented Mar 26, 2015 at 4:22

Your Answer

By clicking “Post Your Answer”, you agree to our terms of service and acknowledge you have read our privacy policy.

Not the answer you're looking for? Browse other questions tagged or ask your own question.