0
$\begingroup$

I have some Bode plot (only in amplitude) as these:
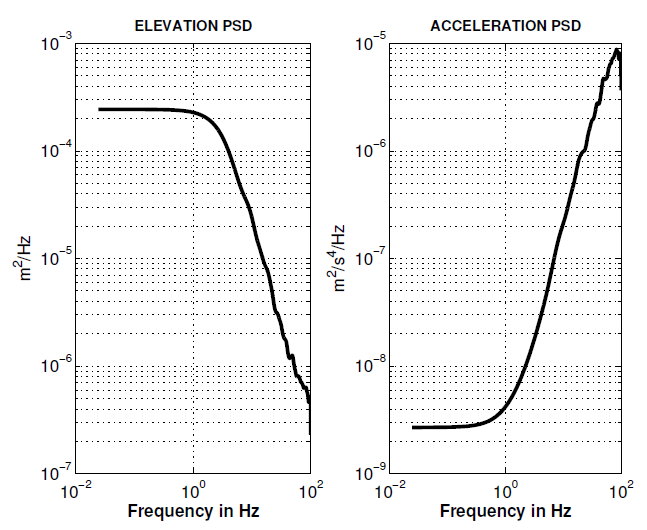
Example of two Bode plots

Now, I must to find their transfer functions, in particular the exact value of their zeros and poles.

It is clear that their are a low pass filter and a high pass filter.

I'm looking for a method for extract the numerical value of their transfer function.

Thank you and bye,
Giacomo

$\endgroup$
2
  • 1
    $\begingroup$ This might help: en.m.wikipedia.org/wiki/Bode_plot . Have you already tried to reconstruct the transfer function applying the same rules you use when drawing the plot? $\endgroup$
    – Rhei
    Commented Feb 16, 2015 at 16:46
  • $\begingroup$ Yes, I have read that page. I'm asking if for the first one which is a low pass filter, i.e., $H(s)=\frac{k}{p+j\Omega}$ there are some tools for extract the values of $k$ and $p$. $\endgroup$ Commented Feb 16, 2015 at 16:56

1 Answer 1

2
$\begingroup$

locate the 3db point. (The point where the line before and after the curve would meet.) Take note of the magnitude and frequency f.

Find the angular frequency at this point. w = 2 * pi * f

If the graph is going up then it's a zero. H(s) = w + s

If it's going down then it's a pole. H(s) = 1 / ( w + s )

Once you've got that. check the slope. If it's 20dB/decade then you're set. If it is 40, you'll need to square it, 60 and you'll cube it etc.

Finally you'll need to find the gain constant to make it correct at low frequency (or DC)

So you're answers will look like this:

H(s) = Gain * ( w + s )
H(s) = Gain / ( w + s )
$\endgroup$

Your Answer

By clicking “Post Your Answer”, you agree to our terms of service and acknowledge you have read our privacy policy.

Not the answer you're looking for? Browse other questions tagged or ask your own question.