4
$\begingroup$

Please help me understand the following MATLAB code for Ideal Low pass filter. I am unable to understand the Part2 in the below code. Please explain me why we are doing like this.

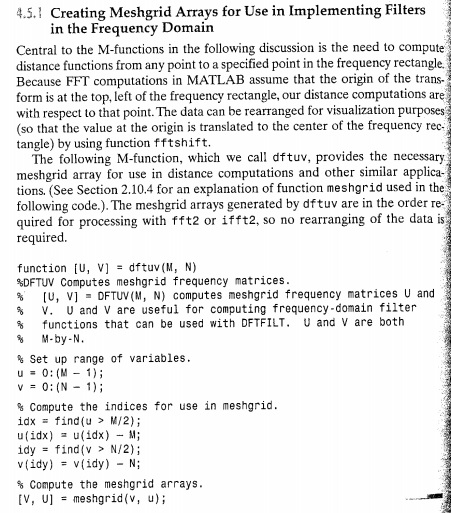
I have read the Rafael C. Gonzalez's Digital Image Processing Using Matlab 2E which explains my question but I couldn't understand properly. It states that DFTUV Computes meshgrid frequency matrices. I don't understand this "meshgrid frequency matrices".It will be very much helpful if someone could explain me clearly.

 %IDEAL LOW-PASS FILTER

%Part 1
        function idealfilter(X,P) % X is the input image and P is the cut-off freq
        f=imread(X);  % reading an image X
        [M,N]=size(f); % Saving the the rows of X in M and columns in N
        F=fft2(double(f)); % Taking Fourier transform to the input image
%Part 2 % I don't understand this part
        u=0:(M-1);
        v=0:(N-1);
        idx=find(u>M/2);
        u(idx)=u(idx)-M;
        idy=find(v>N/2);
        v(idy)=v(idy)-N;
        [V,U]=meshgrid(v,u);
        D=sqrt(U.^2+V.^2);

%Part 3
        H=double(D<=P);       % Comparing with the cut-off frequency 
        G=H.*F;               % Multiplying the Fourier transformed image with H
        g=real(ifft2(double(G))); % Inverse Fourier transform
        imshow(f),figure,imshow(g,[ ]); % Displaying input and output image
        end

I tried to run each commands in Part2 individually for M= 8 and N=8. I get

u=0:(M-1); ==> u = 0 1 2 3 4 5 6 7

v=0:(N-1); ==> v = 0 1 2 3 4 5 6 7

idx=find(u>M/2); ==> idx = 6 7 8 

u(idx)=u(idx)-M; ==> 0 1 2 3 4 -3 -2 -1

idy=find(v>N/2); ==> idy = 6 7 8 

v(idy)=v(idy)-N; ==> 0 1 2 3 4 -3 -2 -1

[V,U]=meshgrid(v,u); ==> 

V=

     0     1     2     3     4    -3    -2    -1
     0     1     2     3     4    -3    -2    -1
     0     1     2     3     4    -3    -2    -1
     0     1     2     3     4    -3    -2    -1
     0     1     2     3     4    -3    -2    -1
     0     1     2     3     4    -3    -2    -1
     0     1     2     3     4    -3    -2    -1
     0     1     2     3     4    -3    -2    -1

U =

     0     0     0     0     0     0     0     0
     1     1     1     1     1     1     1     1
     2     2     2     2     2     2     2     2
     3     3     3     3     3     3     3     3
     4     4     4     4     4     4     4     4
    -3    -3    -3    -3    -3    -3    -3    -3
    -2    -2    -2    -2    -2    -2    -2    -2
    -1    -1    -1    -1    -1    -1    -1    -1

I am unsure why they are doing like this. How it affects the image.Please help me understand. The fftshift is used to avoid the wraparound error. Is the above operation anyway related to fftshift command? My understanding is that they are doing this to avoid using the fftshift command. Thanks in advance. Help me learn.

Reference: Rafael C. Gonzalez's Digital Image Processing Using Matlab 2E
DFTUV Computes meshgrid frequency matrices

$\endgroup$
1
  • $\begingroup$ Part 2 is a convoluted way of creating matrix D $\endgroup$
    – sav
    Commented Nov 9, 2013 at 2:11

2 Answers 2

3
$\begingroup$

meshgrid is simply a way to create a discrete grid. If you think of a regular MATLAB matrix of size MxN, it defines indices from 1 to N in x and from 1 to M in y, with the step size of 1. But let's say you want to evaluate some function f(x,y) on the x-interval [-3, 1] and the y-interval [-1, 2], and you want your step size to be .2. The meshgrid helps you create a matrix of all the x-values and a matrix of all the y-values. If you do

[X,Y] = meshgrid(-3:0.2:1, -1:0.2:2);

You can then easily evaluate your function f(x,y). For example f(X(1),Y(1)) = f(-3, -1). Of if f is a vectorized MATLAB function, you should be able to evaluate it on your entire grid with one line:

Z = f(X(:), Y(:));

In this particular example, the meshgrids contain the indices of the frequency coefficients in the same order used by fft2 function. Remember, the Fourier transform of an image is periodic, it wraps around. For calculations it is convenient to have the zero frequency at (0,0), then the positive frequencies, and then the negative frequencies wrapping around.

On the other hand, for visualization it is convenient to have the zero frequency in the center. This is what the fftshift function does. It is used purely for visualization.

$\endgroup$
5
  • $\begingroup$ D is a matrix of the squared 'distances' of U and V. I understood. So is it right to say that we are comparing the squared distances with the cutoff frequency value and not with the DFT co-efficients which we obtained by taking fft of the input image? If so Why can't we compare the F matrix(Fourier transformed matrix) directly with the cutoff frequency ? Why we need squared distance? $\endgroup$
    – Premnath D
    Commented Nov 9, 2013 at 12:36
  • $\begingroup$ The F matrix contains the Fourier coefficients not the frequencies. Think of a 1D function y = f(x). You are trying to limit the range of x, but the F matrix contains the equivalent of the y values. $\endgroup$
    – Dima
    Commented Nov 11, 2013 at 18:43
  • $\begingroup$ Thank u for ur explanation. Why we need the distances? What it tells us? $\endgroup$
    – Premnath D
    Commented Nov 12, 2013 at 3:56
  • $\begingroup$ Those distances tell you which frequencies to keep, and which to throw out. $\endgroup$
    – Dima
    Commented Nov 16, 2013 at 0:45
  • $\begingroup$ Thank u. Understood . Clearly explained by mags in the below link: dsp.stackexchange.com/questions/12621/… $\endgroup$
    – Premnath D
    Commented Nov 17, 2013 at 7:48
1
$\begingroup$

That code is a bit convoluted in its approach. The purpose of all of part 2 is to create the matrix D. The minus signs in matrices U and V end up being irrelevant due to the squaring operation that happens latter. D is a matrix of the squared 'distances' of U and V.

Print out matrix D and take a look at it. Also print out matrix H and look at this, as this is the matrix after it has been filtered.

The operation G=H.*F performs the task of filtering certain parts of the Fourier transformed image F. Pixels in a location of the image F will correspond to certain frequencies. Cutting out the lower frequencies around the edges fill have the effect of a low pass filter when the transform is inverted.

$\endgroup$
4
  • $\begingroup$ D is a matrix of the squared 'distances' of U and V. I understood. So is it right to say that we are comparing the squared distances with the cutoff frequency value and not with the DFT co-efficients which we obtained by taking fft of the input image? If so Why can't we compare the F matrix(Fourier transformed matrix) directly with the cutoff frequency ? Why we need squared distance? $\endgroup$
    – Premnath D
    Commented Nov 9, 2013 at 12:34
  • $\begingroup$ D = sqrt(U.^2 + V.^2) uses Pythagoras theorem to to find the distance. (Sorry I reffered to it as squared distance) . $\endgroup$
    – sav
    Commented Nov 9, 2013 at 17:25
  • $\begingroup$ cns-alumni.bu.edu/~slehar/fourier/fourier.html $\endgroup$
    – sav
    Commented Nov 9, 2013 at 18:22
  • $\begingroup$ K let it be distances. I still I have the following doubt. It looks silly but I didn't understand it clearly. Please clear my doubt. Is it right to say that we are comparing the distances with the cutoff frequency value and not with the DFT co-efficients which we obtained by taking fft of the input image? Why we need distance? What information it provides about image? Why can't we compare the F matrix(Fourier transformed matrix) directly with the cutoff frequency ? $\endgroup$
    – Premnath D
    Commented Nov 10, 2013 at 1:02

Your Answer

By clicking “Post Your Answer”, you agree to our terms of service and acknowledge you have read our privacy policy.

Not the answer you're looking for? Browse other questions tagged or ask your own question.