0
$\begingroup$

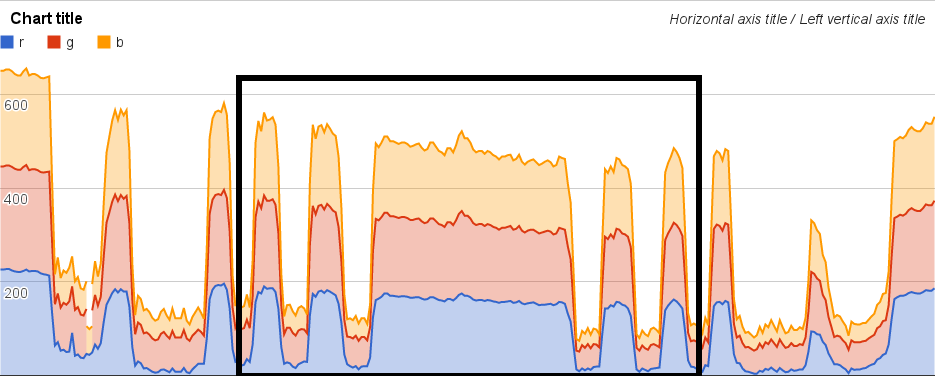
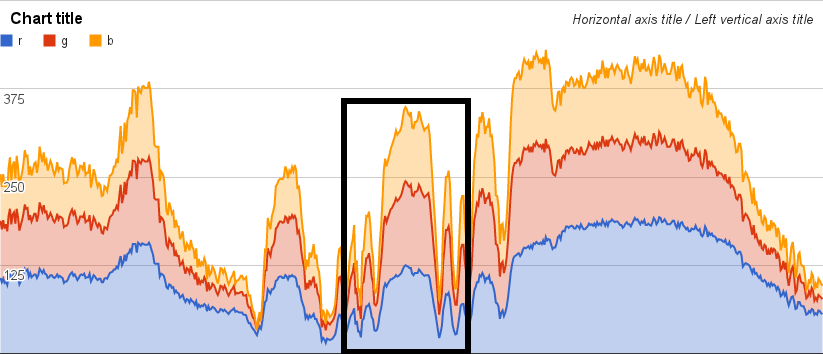
Black rectangles on these charts show same signal, which is actually color sequence from a image, taken from different positions.

enter image description here

enter image description here

enter image description here

enter image description here

It is easy to see that all images contain same pattern. Is here some algorithm which can detect these similarities, ideally implemented in Python ?

What about cut signals in multiple windows and try computing cross corelation on them ?

$\endgroup$
2
  • $\begingroup$ You should provide a more robust specification for your pattern matching as it will make the problem easier to solve. You say that the images "contain [the] same pattern" but to which features of the signal are you actually referring? $\endgroup$
    – PAK-9
    Commented Oct 14, 2013 at 17:39
  • $\begingroup$ These are RGB channels of a single row from the image. $\endgroup$
    – user29467
    Commented Oct 14, 2013 at 18:37

2 Answers 2

1
$\begingroup$

More detail like PAK-9 asks, and example images with the pattern indicated, would help get better answers. If you update your question with details and data, you're also more likely to get example implementations.

That said, this looks to be a candidate for a wavelet transform (like with pywavelets), which would allow for the stretching and scaling that you need to capture the variations of the pattern. Pre-computed wavelets can be browsed here, or you can roll your own (like the fast 2D CDF 9/7 lifting transform).

You suggested cross-correlation, which might be good for a first pass (see scikit-image template matching for ideas). You might modify this to loop through windows to account for the stretching and scaling, but you'll want to normalize them if you intend to subsequently use a classifier. Also, the relative width and spacing of the peaks seem conserved, which would lend itself to windowed supervised classification by many means, like SVM or Random Forests (scikit-learn has plenty of classifiers and examples for you).

$\endgroup$
1
  • $\begingroup$ Charts show stripe of pixels, one 1px height from this area. Basically I'm trying to do Haar cascade detection without that painful and long training process. i.imgur.com/kq5PwtH.jpg Haar cascades uses Wavelets, so thank you for that link to PyWavelets, scikit-image looks extremly useful as well, it looks much better then OpenCV python API $\endgroup$
    – user29467
    Commented Oct 15, 2013 at 9:43
0
$\begingroup$

The cross correlation idea may work well, but you will have to perform it with varying levels of stretching.

The cross correlation will be computed using a 2D window of length L and height H representing the activity. Choose a moderate length L that resembles the expected length of the activity. Assume that in the 'white regions' the function value is a constant that is different from the values representing the activity filled regions. This way your 2D window can have up to 4 different function values representing the r,g,b, and w segments. .

The cross correlation will be taken between the signal and this window for n iterations where in each iteration the enlarging/shrinking factor takes a new value. You probably won't need the three channels.

$\endgroup$

Your Answer

By clicking “Post Your Answer”, you agree to our terms of service and acknowledge you have read our privacy policy.

Not the answer you're looking for? Browse other questions tagged or ask your own question.