For fun, I computed the FFT of a pure sine wave. I chose chose the sample length to be an even multiple of the signal period, so that I don't see windowing-effects. Here is the Matlab code that I used:
% Signal properties
f_signal = 1000;

% Sampling properties
f_sample = 4000;
T_total = 100;

% Calculate signal vector
t = 0:1/f_sample:T_total;
N = length(t);
V = sin(2*pi*f_signal*t);

% Calculate FFT
f_spectrum = (0:N-1)/N*f_sample;
V_spectrum = abs(fft(V))/(N/2);

% Plot
figure(2)
semilogy(f_spectrum, V_spectrum)
set(gca, 'XLim', [f_signal-5, f_signal+5])
xlabel('Frequency in Hz')
ylabel('Normalized amplitude')
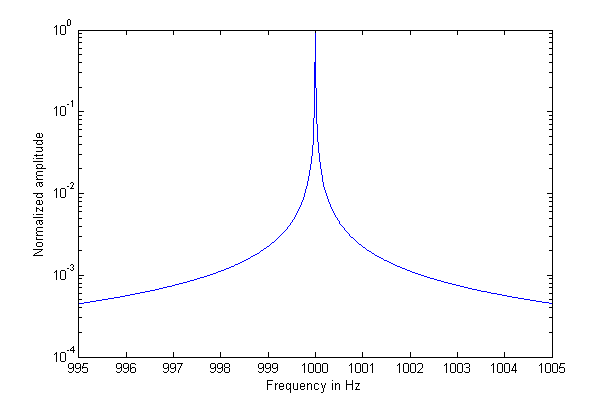
But instead of a single peak, I get the following result:

This strikes me as odd for two reasons:
- The effect is really huge. The center peak has an amplitude of 0.9 instead of 1, and the next bin to the right has an amplitude of 0.3 instead of 0.
- While I would expect that limited numerical precision broadens my peak a bit, I am quite surprised that the effect is so silky smooth. I always thought of rounding errors as "noise" of the least significant digit. Noise usually leads to jarry spectra.
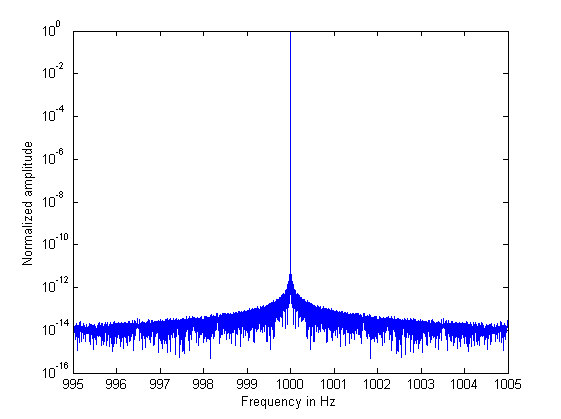
I observed that if I choose a slightly lower frequency (999.9975) then the effect is minimal. What is going on here?

