3
$\begingroup$

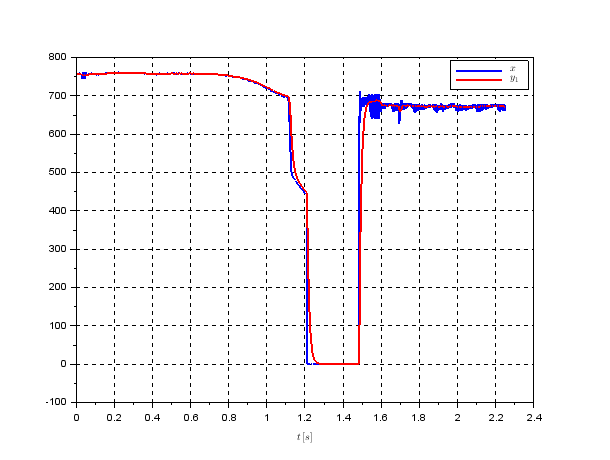
I have below given digital signal (sampled with period $T = 1\,\mathrm{ms}$) for which I need to evaluate its decrese. Namely I am interested in regions where the signal decreases faster than $-1000\,\mathrm{V}\cdot s^{-1}$.

enter image description here

My first idea how to do that was to evaluate the first derivative of the signal and compare it against zero. Due to the fact that the signal is noisy I have been filtering the signal via the first order low pass filter with time constant $\tau = 10\,\mathrm{ms}$ at first

$$ y_1(k) = \frac{T}{T + \tau}\cdot x(k) + \frac{\tau}{T + \tau}\cdot y(k-1) $$

The processing method can be basically described via following block diagram

enter image description here

The first derivative is evaluated via below given difference equation

$$ y_2(k) = \frac{1}{2\cdot T}\cdot\left[y_1(k) - y_1(k-2)\right] $$

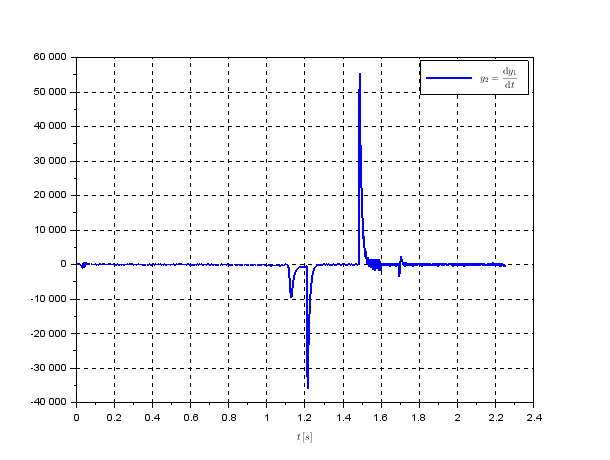
corresponding to the average of the two consecutive first differences. The proposed processing method gives below given first derivative in following form.

enter image description here

I have doubts regarding the proposed method because the derivative is also little bit noisy despite the fact it is evaluated from the filtered signal.

Here I can see a possible solution consisting of further decrease the pass band of the low pass filter or apply some hysteresis band around zero in the comparator. Nevertheless both of these approaches seems to me to be fragile solution. My question is whether you know any better method suitable for signal decrease detection. Thanks in advance for any ideas.

$\endgroup$
11
  • 2
    $\begingroup$ You need a crisp definition of what exactly "decrease" means within the context of your specific application. As stupid as it sounds: that's actually the most difficult part. Once you have a good set of requirements, the algorithm typically just follows along. $\endgroup$
    – Hilmar
    Commented May 31, 2023 at 9:03
  • $\begingroup$ @Hilmar thank you for your reaction. Let's say I will have a precise requirement regarding the decrease e.g. $-1000\,\mathrm{V}\cdot\mathrm{s}^{-1}$. Can you tell me your opinion regarding the proposed detection method. $\endgroup$
    – Steve
    Commented May 31, 2023 at 11:39
  • 1
    $\begingroup$ isy.gitlab-pages.liu.se/fs/en/courses/TSFS06/PDFs/… Based on what you wrote, I recommend either CUSUM algorithm or filtered derivative $\endgroup$
    – Ben
    Commented May 31, 2023 at 11:41
  • $\begingroup$ FIY, your post describes a specific case of the filtered derivative. $\endgroup$
    – Ben
    Commented May 31, 2023 at 11:58
  • 1
    $\begingroup$ You could also try running $x$ through a median filter prior to estimating its derivative. Order statistic filters are far more robust to outliers than your exponential moving average. $\endgroup$
    – Ash
    Commented May 31, 2023 at 20:51

1 Answer 1

3
$\begingroup$

I agree with Ben: use the CUSUM algorithm first up and see if that meets your needs.

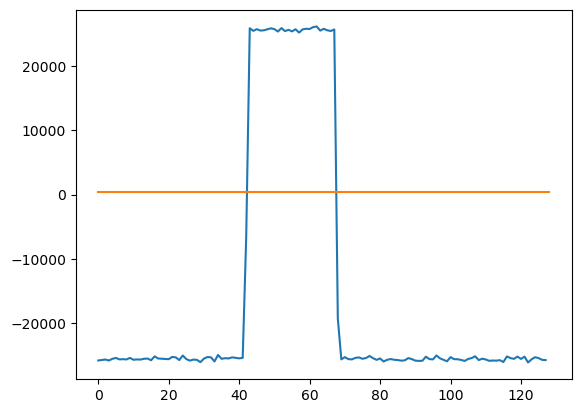
If I do a rudimentary attempt at simulating your signal and implementing CUSUM, then I get the output shown below. The orange line is the threshold.

You'll need to play with $N$, the length over which the statistic is calculated and $\kappa$ the alarm / threshold parameter.

CUSUM algorithm statistic and threshold


Code Below

import numpy as np
import matplotlib.pyplot as plt 
import scipy

# Let's try a CUSUM implementation for change in 
# mean following Basseville Example 2.1.1

mu0 = 800.0
mu1 = 0
Sigma = 10
NumSamples = 1024 # Number of samples
DropSample = int(NumSamples/3)
DropDuration = int(NumSamples/5)

x = np.concatenate((mu0*np.ones(DropSample),   
    DropLevel*np.ones(DropDuration), 
    StartLevel*np.ones(NumSamples-DropSample-DropDuration)))

xn = x + np.random.normal(0,NoiseStdDev,len(x))


def sufficientStatistic(yi, mu0, mu1, sigma):
    return (mu1-mu0)/sigma/sigma*(yi-(mu0+mu1)/2)

def S1N(yN, mu0, mu1, sigma):
    N = len(yN)
    return np.sum(sufficientStatistic(yN, mu0, mu1, sigma))

def decisionFunction(y, N, mu0, mu1, sigma):
    K = int(len(y)/N)
    values = np.zeros(K)
    
    for k in range(K):
        values[k] = S1N(y[range(k*N, (k+1)*N)], mu0, mu1, sigma)
        
    return values

N = 8
decisionValues = decisionFunction(xn, N, mu0, mu1, Sigma)    
kappa = 100
threshold = mu0 - kappa*Sigma/np.sqrt(N)

plt.figure(3)
plt.plot(decisionValues)
plt.plot([0,len(decisionValues)], [threshold, threshold])
$\endgroup$
5
  • $\begingroup$ Thanks @OverLordGoldDragon, I didn’t realize it wouldn’t keyword highlight. The standard code seems to be … suboptimal. $\endgroup$
    – Peter K.
    Commented Jun 1, 2023 at 23:07
  • 1
    $\begingroup$ That's cool- I didn't know about that feature for showing the code. $\endgroup$ Commented Jun 2, 2023 at 10:15
  • 1
    $\begingroup$ @DanBoschen it got turned on a while ago, but it needs help to know what language to highlight for keywords. $\endgroup$
    – Peter K.
    Commented Jun 2, 2023 at 11:08
  • $\begingroup$ Now to figure out Matt's <pre>ference... $\endgroup$ Commented Jun 3, 2023 at 2:59
  • 1
    $\begingroup$ Few other things - slice is faster and doesn't create a copy, and Spyder is great $\endgroup$ Commented Jun 3, 2023 at 3:07

Your Answer

By clicking “Post Your Answer”, you agree to our terms of service and acknowledge you have read our privacy policy.

Not the answer you're looking for? Browse other questions tagged or ask your own question.