Became Hot Network Question
edited tags
Link
Matt L.
  • 92.5k
  • 10
  • 81
  • 184
fixed the typo in the title
Source Link
jomegaA
  • 669
  • 3
  • 16

zero-centered and casualcausal zero padding

I have followed the link below to simulate two different zero-padding methods (zero-centered and casualcausal)

https://ccrma.stanford.edu/~jos/mdft/Zero_Padding.html

Sample code

close all;
clear all;

x           = [3 2 1 1 2];
n           = length(x);

fft_len     = 32;

zeropadd    = fft_len - n;

y           = [x(1:(n-1)/2+1) zeros(1,zeropadd) x((n-1)/2+2:end)];

y_normal    = [y(fft_len/2+2:fft_len) y(1:fft_len/2)];

x_zeropad   = [x zeros(1,zeropadd)];

y_fft       = fft(y);

y_normal_fft = fft(y_normal);

x_fft       = fft(x, fft_len);

x_zp_fft    = fft(x_zeropad);

subplot(421)
stem(y)
xlabel 'n',
ylabel 'y'

subplot(422)
stem(y_fft)
xlabel 'n',
ylabel 'fft(y)'

subplot(423)
stem(y_normal)
xlabel 'n',
ylabel 'y-normal'

subplot(424)
stem(y_normal_fft)
xlabel 'n',
ylabel 'fft(y-normal)'

subplot(425)
stem(x)
xlabel 'n',
ylabel 'x'

subplot(426)
stem(x_fft)
xlabel 'n',
ylabel 'fft(x, fft_len)'

subplot(427)
stem(x_zeropad)
xlabel 'n',
ylabel 'x-zp'

subplot(428)
stem(x_zp_fft)
xlabel 'n',
ylabel 'fft(x-zp)'

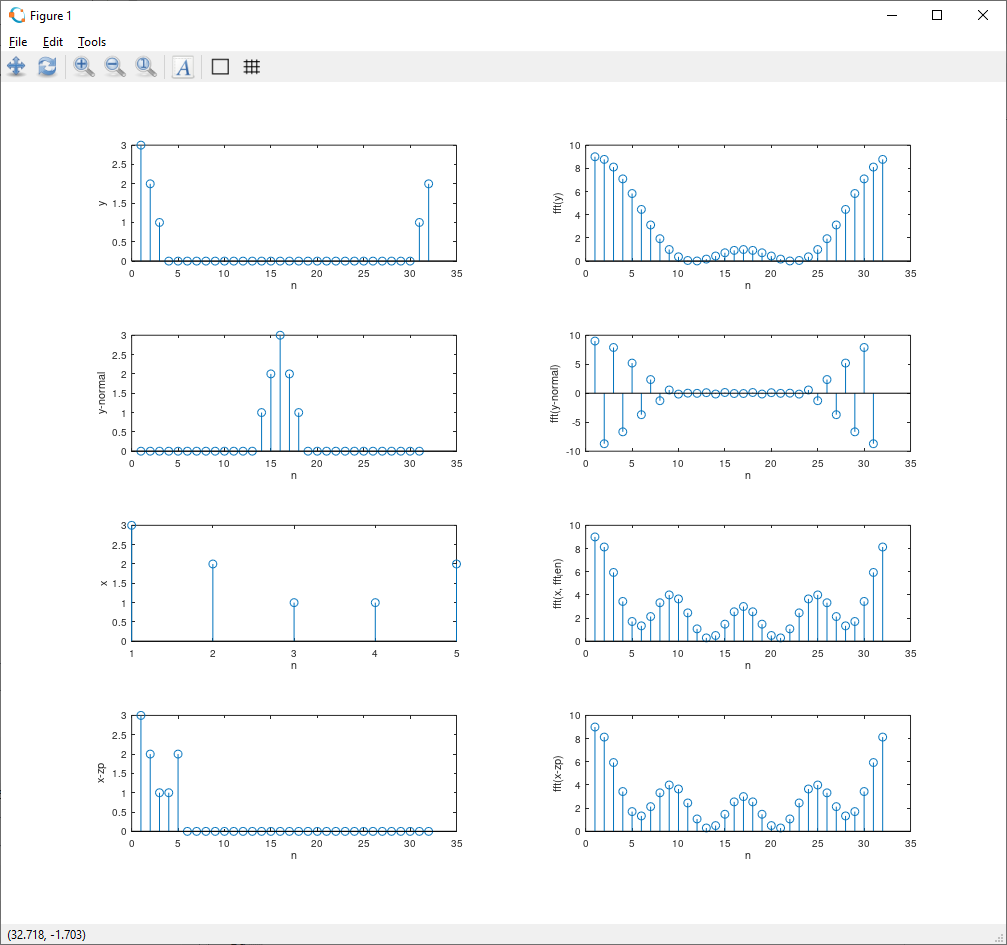
Output is

enter image description here

My question is why is the spectrum of fft(y), fft(y_normal) is different from fft(x) and fft(x_zp)

zero-centered and casual zero padding

I have followed the link below to simulate two different zero-padding methods (zero-centered and casual)

https://ccrma.stanford.edu/~jos/mdft/Zero_Padding.html

Sample code

close all;
clear all;

x           = [3 2 1 1 2];
n           = length(x);

fft_len     = 32;

zeropadd    = fft_len - n;

y           = [x(1:(n-1)/2+1) zeros(1,zeropadd) x((n-1)/2+2:end)];

y_normal    = [y(fft_len/2+2:fft_len) y(1:fft_len/2)];

x_zeropad   = [x zeros(1,zeropadd)];

y_fft       = fft(y);

y_normal_fft = fft(y_normal);

x_fft       = fft(x, fft_len);

x_zp_fft    = fft(x_zeropad);

subplot(421)
stem(y)
xlabel 'n',
ylabel 'y'

subplot(422)
stem(y_fft)
xlabel 'n',
ylabel 'fft(y)'

subplot(423)
stem(y_normal)
xlabel 'n',
ylabel 'y-normal'

subplot(424)
stem(y_normal_fft)
xlabel 'n',
ylabel 'fft(y-normal)'

subplot(425)
stem(x)
xlabel 'n',
ylabel 'x'

subplot(426)
stem(x_fft)
xlabel 'n',
ylabel 'fft(x, fft_len)'

subplot(427)
stem(x_zeropad)
xlabel 'n',
ylabel 'x-zp'

subplot(428)
stem(x_zp_fft)
xlabel 'n',
ylabel 'fft(x-zp)'

Output is

enter image description here

My question is why is the spectrum of fft(y), fft(y_normal) is different from fft(x) and fft(x_zp)
zero-centered and causal zero padding

I have followed the link below to simulate two different zero-padding methods (zero-centered and causal)

https://ccrma.stanford.edu/~jos/mdft/Zero_Padding.html

Sample code

close all;
clear all;

x           = [3 2 1 1 2];
n           = length(x);

fft_len     = 32;

zeropadd    = fft_len - n;

y           = [x(1:(n-1)/2+1) zeros(1,zeropadd) x((n-1)/2+2:end)];

y_normal    = [y(fft_len/2+2:fft_len) y(1:fft_len/2)];

x_zeropad   = [x zeros(1,zeropadd)];

y_fft       = fft(y);

y_normal_fft = fft(y_normal);

x_fft       = fft(x, fft_len);

x_zp_fft    = fft(x_zeropad);

subplot(421)
stem(y)
xlabel 'n',
ylabel 'y'

subplot(422)
stem(y_fft)
xlabel 'n',
ylabel 'fft(y)'

subplot(423)
stem(y_normal)
xlabel 'n',
ylabel 'y-normal'

subplot(424)
stem(y_normal_fft)
xlabel 'n',
ylabel 'fft(y-normal)'

subplot(425)
stem(x)
xlabel 'n',
ylabel 'x'

subplot(426)
stem(x_fft)
xlabel 'n',
ylabel 'fft(x, fft_len)'

subplot(427)
stem(x_zeropad)
xlabel 'n',
ylabel 'x-zp'

subplot(428)
stem(x_zp_fft)
xlabel 'n',
ylabel 'fft(x-zp)'

Output is

enter image description here

My question is why is the spectrum of fft(y), fft(y_normal) is different from fft(x) and fft(x_zp)

Updated the question with an plot and its spectrum.
Source Link
jomegaA
  • 669
  • 3
  • 16

I have followed the link below to simulate two different zero-padding methods (zero-centered and casual)

https://ccrma.stanford.edu/~jos/mdft/Zero_Padding.html

Sample code

close all;
clear all;

x           = [3 2 1 1 2];
n           = length(x);

fft_len     = 64;32;

zeropadd    = fft_len - n;

y           = [x(1:(n-1)/2+1) zeros(1,zeropadd) x((n-1)/2+2:end)];

y_normal    = [y(fft_len/2+2:fft_len) y(1:fft_len/2)];

x_zeropad   = [x zeros(1,zeropadd)];

y_fft       = fft(y);

y_normal_fft = fft(y_normal);

x_fft       = fft(x, fft_len);

x_zp_fft    = fft(x_zeropad);

subplot(311421)
stem(y)
xlabel 'n',
ylabel 'y'

subplot(422)
stem(y_fft)
xlabel 'n',
ylabel 'fft(y)'

subplot(312423)
stem(y_normal)
xlabel 'n',
ylabel 'y-normal'

subplot(424)
stem(y_normal_fft)
xlabel 'n',
ylabel 'fft(y-normal)'

subplot(425)
stem(x)
xlabel 'n',
ylabel 'x'

subplot(426)
stem(x_fft)
xlabel 'n',
ylabel 'fft(x, fft_len)'

subplot(313427)
stem(x_zeropad)
xlabel 'n',
ylabel 'x-zp'

subplot(428)
stem(x_zp_fft)
xlabel 'n',
ylabel 'fft(x_zpx-zp)'

Output is

enter image description hereenter image description here

My question is why is the spectrum of fft(y), fft(y_normal) is different from fft(x) and fft(x_zp)

I have followed the link below to simulate two different zero-padding methods (zero-centered and casual)

https://ccrma.stanford.edu/~jos/mdft/Zero_Padding.html

Sample code

close all;
clear all;

x           = [3 2 1 1 2];
n           = length(x);

fft_len     = 64;

zeropadd    = fft_len - n;

y           = [x(1:(n-1)/2+1) zeros(1,zeropadd) x((n-1)/2+2:end)];

x_zeropad   = [x zeros(1,zeropadd)];

y_fft       = fft(y);

x_fft       = fft(x, fft_len);

x_zp_fft    = fft(x_zeropad);

subplot(311)
stem(y_fft)
xlabel 'n',
ylabel 'fft(y)'

subplot(312)
stem(x_fft)
xlabel 'n',
ylabel 'fft(x)'

subplot(313)
stem(x_zp_fft)
xlabel 'n',
ylabel 'fft(x_zp)'

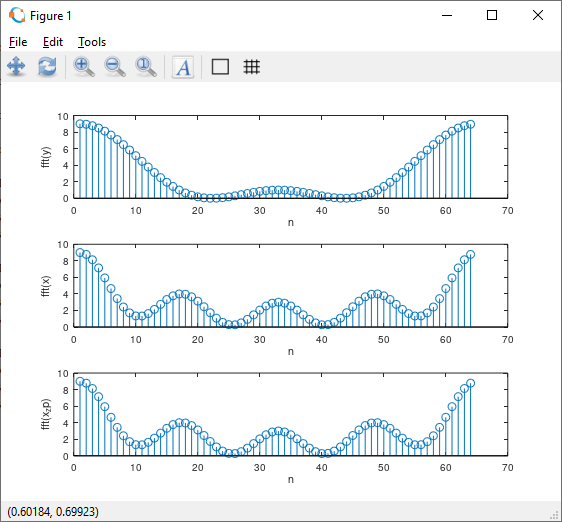
Output is

enter image description here

My question is why is the spectrum of fft(y) is different from fft(x) and fft(x_zp)

I have followed the link below to simulate two different zero-padding methods (zero-centered and casual)

https://ccrma.stanford.edu/~jos/mdft/Zero_Padding.html

Sample code

close all;
clear all;

x           = [3 2 1 1 2];
n           = length(x);

fft_len     = 32;

zeropadd    = fft_len - n;

y           = [x(1:(n-1)/2+1) zeros(1,zeropadd) x((n-1)/2+2:end)];

y_normal    = [y(fft_len/2+2:fft_len) y(1:fft_len/2)];

x_zeropad   = [x zeros(1,zeropadd)];

y_fft       = fft(y);

y_normal_fft = fft(y_normal);

x_fft       = fft(x, fft_len);

x_zp_fft    = fft(x_zeropad);

subplot(421)
stem(y)
xlabel 'n',
ylabel 'y'

subplot(422)
stem(y_fft)
xlabel 'n',
ylabel 'fft(y)'

subplot(423)
stem(y_normal)
xlabel 'n',
ylabel 'y-normal'

subplot(424)
stem(y_normal_fft)
xlabel 'n',
ylabel 'fft(y-normal)'

subplot(425)
stem(x)
xlabel 'n',
ylabel 'x'

subplot(426)
stem(x_fft)
xlabel 'n',
ylabel 'fft(x, fft_len)'

subplot(427)
stem(x_zeropad)
xlabel 'n',
ylabel 'x-zp'

subplot(428)
stem(x_zp_fft)
xlabel 'n',
ylabel 'fft(x-zp)'

Output is

enter image description here

My question is why is the spectrum of fft(y), fft(y_normal) is different from fft(x) and fft(x_zp)

Source Link
jomegaA
  • 669
  • 3
  • 16
Loading