minor formatting, list + symbols
Source Link
Gilles
  • 3.4k
  • 3
  • 23
  • 29

The Fast Fourier Transform takes O(N log N)$\mathcal O(N \log N)$ operations, while the Fast Wavelet Transform takes O(N)$\mathcal O(N)$. ButBut what, specifically, does the FWT compute?

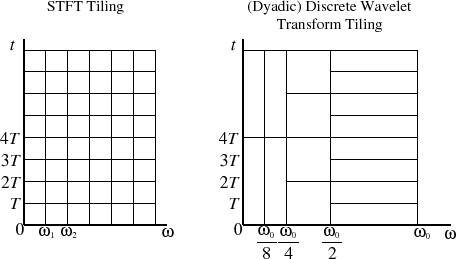
Although they are often compared, it seems like the FFT and FWT are apples and oranges. As I understand it, it would be more appropriate to compare the STFT (FFTs of small chunks over time) with the complex Morlet WT, since they're both time-frequency representations based on complex sinusoids (please correct me if I'm wrong). ThisThis is often shown with a diagram like this:

The left shows how the STFT is a bunch of FFTs stacked on top of each other as time passes (this representation is the origin of the spectrogram), while the right shows the dyadic WT, which has better time resolution at high frequencies and better frequency resolution at low frequencies (this representation is called a scalogram). InIn this example, N$N$ for the STFT is the number of vertical columns (6), and a single O(N log N)$\mathcal O(N \log N)$ FFT operation calculates a single row of N$N$ coefficients from N$N$ samples. TheThe total is 8 FFTs of 6 points each, or 48 samples in the time domain.

What I don't understand: How many coefficients does a single O(N) FWT operation compute, and where are they located on the time-frequency chart above? Which rectangles get filled in by a single computation?

If we calculate an equal-area block of time-frequency coefficients using both, do we get the same amount of data out? Is the FWT still more efficient than the FFT?

  • How many coefficients does a single $\mathcal O(N)$ FWT operation compute, and where are they located on the time-frequency chart above?

  • Which rectangles get filled in by a single computation?

  • If we calculate an equal-area block of time-frequency coefficients using both, do we get the same amount of data out?

  • Is the FWT still more efficient than the FFT?

It creates two sets of 4 coefficients, so it's the same as the number of samples in the original signal. ButBut what's the relationship between these 8 coefficients and the tiles in the diagram?

The Fast Fourier Transform takes O(N log N) operations, while the Fast Wavelet Transform takes O(N). But what, specifically, does the FWT compute?

Although they are often compared, it seems like the FFT and FWT are apples and oranges. As I understand it, it would be more appropriate to compare the STFT (FFTs of small chunks over time) with the complex Morlet WT, since they're both time-frequency representations based on complex sinusoids (please correct me if I'm wrong). This is often shown with a diagram like this:

The left shows how the STFT is a bunch of FFTs stacked on top of each other as time passes (this representation is the origin of the spectrogram), while the right shows the dyadic WT, which has better time resolution at high frequencies and better frequency resolution at low frequencies (this representation is called a scalogram). In this example, N for the STFT is the number of vertical columns (6), and a single O(N log N) FFT operation calculates a single row of N coefficients from N samples. The total is 8 FFTs of 6 points each, or 48 samples in the time domain.

What I don't understand: How many coefficients does a single O(N) FWT operation compute, and where are they located on the time-frequency chart above? Which rectangles get filled in by a single computation?

If we calculate an equal-area block of time-frequency coefficients using both, do we get the same amount of data out? Is the FWT still more efficient than the FFT?

It creates two sets of 4 coefficients, so it's the same as the number of samples in the original signal. But what's the relationship between these 8 coefficients and the tiles in the diagram?

The Fast Fourier Transform takes $\mathcal O(N \log N)$ operations, while the Fast Wavelet Transform takes $\mathcal O(N)$. But what, specifically, does the FWT compute?

Although they are often compared, it seems like the FFT and FWT are apples and oranges. As I understand it, it would be more appropriate to compare the STFT (FFTs of small chunks over time) with the complex Morlet WT, since they're both time-frequency representations based on complex sinusoids (please correct me if I'm wrong). This is often shown with a diagram like this:

The left shows how the STFT is a bunch of FFTs stacked on top of each other as time passes (this representation is the origin of the spectrogram), while the right shows the dyadic WT, which has better time resolution at high frequencies and better frequency resolution at low frequencies (this representation is called a scalogram). In this example, $N$ for the STFT is the number of vertical columns (6), and a single $\mathcal O(N \log N)$ FFT operation calculates a single row of $N$ coefficients from $N$ samples. The total is 8 FFTs of 6 points each, or 48 samples in the time domain.

What I don't understand:

  • How many coefficients does a single $\mathcal O(N)$ FWT operation compute, and where are they located on the time-frequency chart above?

  • Which rectangles get filled in by a single computation?

  • If we calculate an equal-area block of time-frequency coefficients using both, do we get the same amount of data out?

  • Is the FWT still more efficient than the FFT?

It creates two sets of 4 coefficients, so it's the same as the number of samples in the original signal. But what's the relationship between these 8 coefficients and the tiles in the diagram?

Tweeted twitter.com/#!/StackSignals/status/138759201819336704
added 515 characters in body
Source Link
endolith
  • 16k
  • 8
  • 70
  • 121

The Fast Fourier Transform takes O(N log N) operations, while the Fast Wavelet Transform takes O(N). But what, specifically, does the FWT compute?

Although they are often compared, it seems like the FFT and FWT are apples and oranges. As I understand it, a more appropriate comparisonit would be more appropriate to compare the STFT (FFTs of small chunks over time) andwith the complex Morlet WTcomplex Morlet WT, since they're both time-frequency representations based on complex sinusoids (please correct me if I'm wrong). This is often shown with a diagram like this:

Grids showing how the coefficients of the FFT and WT correspond to the time-frequency plane

(Another example)

The left shows how the STFT is a bunch of FFTs stacked on top of each other as time passes (this representation is the origin of the spectrogram), while the right shows the dyadic WT, which has better time resolution at high frequencies and better frequency resolution at low frequencies (this representation is called a scalogram). In this example, N for the STFT is the number of vertical columns (6), and a single O(N log N) FFT operation calculates a single row of N coefficients from N samples. The total is 8 FFTs of 6 points each, or 48 samples in the time domain.

What I don't understand: How many coefficients does a single O(N) FWT operation compute, and where are they located on the time-frequency chart above? Which rectangles get filled in by a single computation?

If we calculate an equal-area block of time-frequency coefficients using both, do we get the same amount of data out? Is the FWT still more efficient than the FFT?

Concrete example using PyWavelets:

In [2]: dwt([1, 0, 0, 0, 0, 0, 0, 0], 'haar')
Out[2]:
(array([ 0.70710678,  0.        ,  0.        ,  0.        ]),
 array([ 0.70710678,  0.        ,  0.        ,  0.        ]))

It creates two sets of 4 coefficients, so it's the same as the number of samples in the original signal. But what's the relationship between these 8 coefficients and the tiles in the diagram?

Update:

Actually, I was probably doing this wrong, and should be using wavedec(), which does a multi-level DWT decomposition:

In [4]: wavedec([1, 0, 0, 0, 0, 0, 0, 0], 'haar')
Out[4]: 
[array([ 0.35355339]),
 array([ 0.35355339]),
 array([ 0.5,  0. ]),
 array([ 0.70710678,  0.        ,  0.        ,  0.        ])]

The Fast Fourier Transform takes O(N log N) operations, while the Fast Wavelet Transform takes O(N). But what, specifically, does the FWT compute?

Although they are often compared, it seems like the FFT and FWT are apples and oranges. As I understand it, a more appropriate comparison would be the STFT (FFTs of small chunks over time) and the complex Morlet WT, since they're both time-frequency representations based on complex sinusoids (please correct me if I'm wrong). This is often shown with a diagram like this:

Grids showing how the coefficients of the FFT and WT correspond to the time-frequency plane

(Another example)

The left shows how the STFT is a bunch of FFTs stacked on top of each other as time passes (this representation is the origin of the spectrogram), while the right shows the dyadic WT, which has better time resolution at high frequencies and better frequency resolution at low frequencies (this representation is called a scalogram). In this example, N for the STFT is the number of vertical columns, and a single O(N log N) FFT operation calculates a single row of N coefficients from N samples.

What I don't understand: How many coefficients does a single O(N) FWT operation compute, and where are they located on the time-frequency chart above? Which rectangles get filled in by a single computation?

If we calculate an equal-area block of time-frequency coefficients using both, do we get the same amount of data out? Is the FWT still more efficient than the FFT?

Concrete example using PyWavelets:

In [2]: dwt([1, 0, 0, 0, 0, 0, 0, 0], 'haar')
Out[2]:
(array([ 0.70710678,  0.        ,  0.        ,  0.        ]),
 array([ 0.70710678,  0.        ,  0.        ,  0.        ]))

It creates two sets of 4 coefficients, so it's the same as the number of samples in the original signal. But what's the relationship between these 8 coefficients and the tiles in the diagram?

The Fast Fourier Transform takes O(N log N) operations, while the Fast Wavelet Transform takes O(N). But what, specifically, does the FWT compute?

Although they are often compared, it seems like the FFT and FWT are apples and oranges. As I understand it, it would be more appropriate to compare the STFT (FFTs of small chunks over time) with the complex Morlet WT, since they're both time-frequency representations based on complex sinusoids (please correct me if I'm wrong). This is often shown with a diagram like this:

Grids showing how the coefficients of the FFT and WT correspond to the time-frequency plane

(Another example)

The left shows how the STFT is a bunch of FFTs stacked on top of each other as time passes (this representation is the origin of the spectrogram), while the right shows the dyadic WT, which has better time resolution at high frequencies and better frequency resolution at low frequencies (this representation is called a scalogram). In this example, N for the STFT is the number of vertical columns (6), and a single O(N log N) FFT operation calculates a single row of N coefficients from N samples. The total is 8 FFTs of 6 points each, or 48 samples in the time domain.

What I don't understand: How many coefficients does a single O(N) FWT operation compute, and where are they located on the time-frequency chart above? Which rectangles get filled in by a single computation?

If we calculate an equal-area block of time-frequency coefficients using both, do we get the same amount of data out? Is the FWT still more efficient than the FFT?

Concrete example using PyWavelets:

In [2]: dwt([1, 0, 0, 0, 0, 0, 0, 0], 'haar')
Out[2]:
(array([ 0.70710678,  0.        ,  0.        ,  0.        ]),
 array([ 0.70710678,  0.        ,  0.        ,  0.        ]))

It creates two sets of 4 coefficients, so it's the same as the number of samples in the original signal. But what's the relationship between these 8 coefficients and the tiles in the diagram?

Update:

Actually, I was probably doing this wrong, and should be using wavedec(), which does a multi-level DWT decomposition:

In [4]: wavedec([1, 0, 0, 0, 0, 0, 0, 0], 'haar')
Out[4]: 
[array([ 0.35355339]),
 array([ 0.35355339]),
 array([ 0.5,  0. ]),
 array([ 0.70710678,  0.        ,  0.        ,  0.        ])]
Post Migrated Here from stackoverflow.com (revisions)
Source Link
endolith
  • 16k
  • 8
  • 70
  • 121

Which time-frequency coefficients does the Wavelet transform compute?

The Fast Fourier Transform takes O(N log N) operations, while the Fast Wavelet Transform takes O(N). But what, specifically, does the FWT compute?

Although they are often compared, it seems like the FFT and FWT are apples and oranges. As I understand it, a more appropriate comparison would be the STFT (FFTs of small chunks over time) and the complex Morlet WT, since they're both time-frequency representations based on complex sinusoids (please correct me if I'm wrong). This is often shown with a diagram like this:

Grids showing how the coefficients of the FFT and WT correspond to the time-frequency plane

(Another example)

The left shows how the STFT is a bunch of FFTs stacked on top of each other as time passes (this representation is the origin of the spectrogram), while the right shows the dyadic WT, which has better time resolution at high frequencies and better frequency resolution at low frequencies (this representation is called a scalogram). In this example, N for the STFT is the number of vertical columns, and a single O(N log N) FFT operation calculates a single row of N coefficients from N samples.

What I don't understand: How many coefficients does a single O(N) FWT operation compute, and where are they located on the time-frequency chart above? Which rectangles get filled in by a single computation?

If we calculate an equal-area block of time-frequency coefficients using both, do we get the same amount of data out? Is the FWT still more efficient than the FFT?

Concrete example using PyWavelets:

In [2]: dwt([1, 0, 0, 0, 0, 0, 0, 0], 'haar')
Out[2]:
(array([ 0.70710678,  0.        ,  0.        ,  0.        ]),
 array([ 0.70710678,  0.        ,  0.        ,  0.        ]))

It creates two sets of 4 coefficients, so it's the same as the number of samples in the original signal. But what's the relationship between these 8 coefficients and the tiles in the diagram?