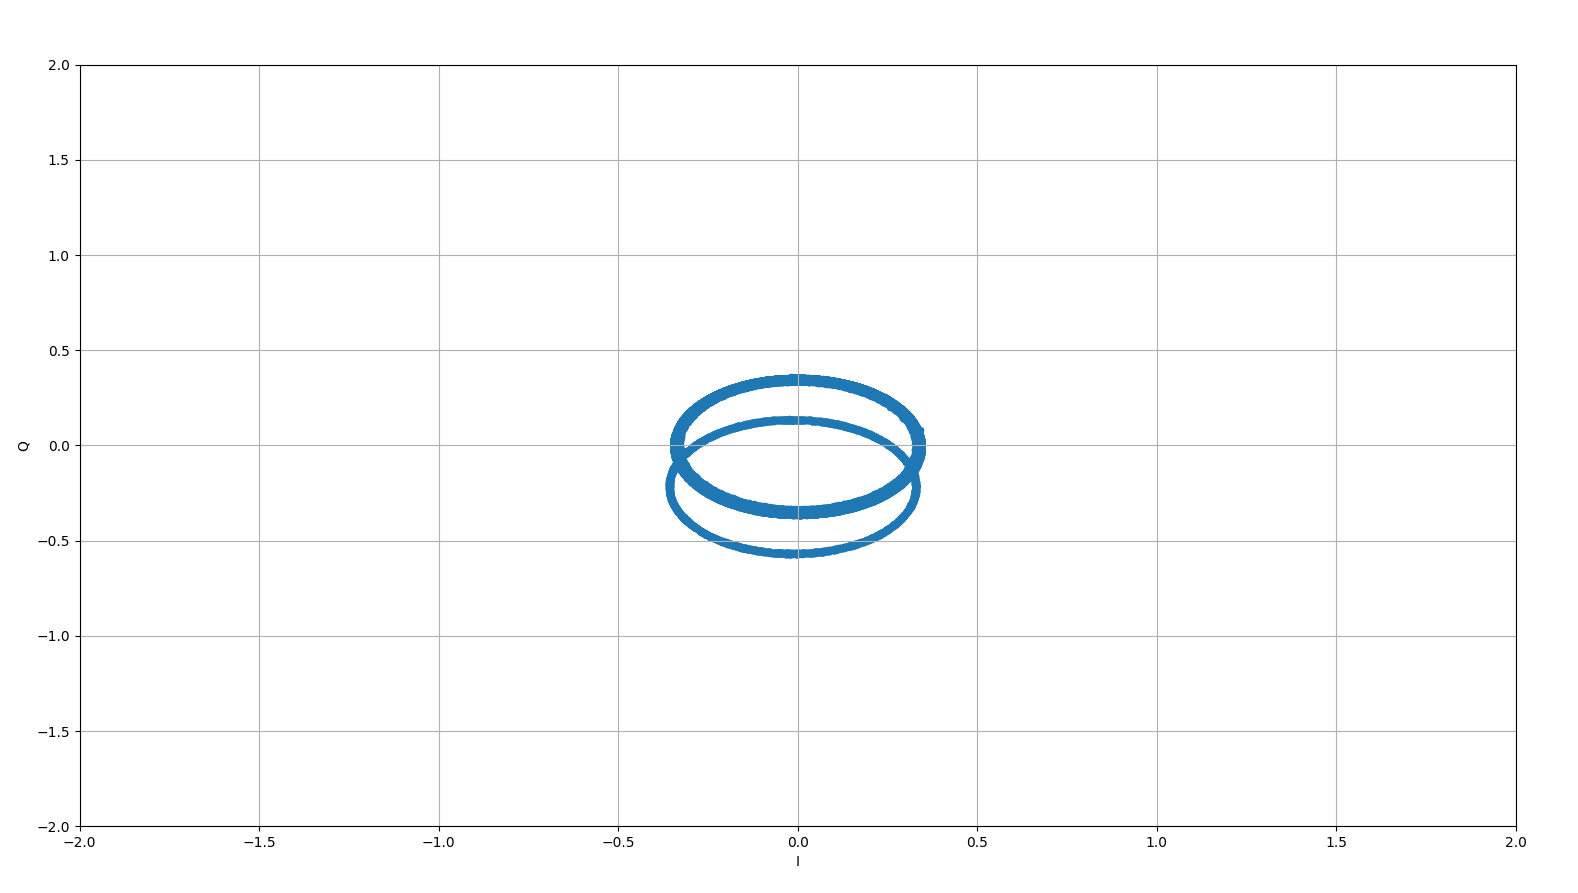
I am experimenting with some signals. I ma generating a 2.47 Ghz signal from signal generator and receiving it by an SDR (LMS7002m Rf chip) with Rx frequency tuned to 2.47 GHz. Upon plotting the received I/Q data I get the following plot. Can anyone help me understanding why there is a second circle below the circle centered at (0,0). Ideally I should be seeing a single circle. .
.
