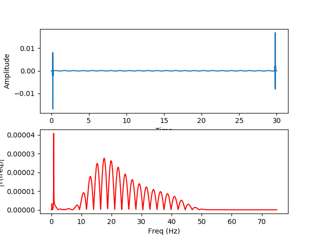
I am trying to implement a band-pass filter from scratch. Here is an article which I thought explained the nuts and bolts of how to build one; the author combines a low-pass with a high-pass filter (convolving both) to create a band-pass filter. I applied it to a mixture of sine waves, but the result was not satisfactory.
import numpy as np
from numpy import sin, linspace, pi
from pylab import figure, plot, show, title, xlabel, ylabel, subplot, savefig, xlim, ylim
from scipy import fft, arange

def plotSpectrum(y,Fs):
    n = len(y) # length of the signal
    k = arange(n)
    T = n/Fs
    frq = k/T # two sides frequency range
    frq = frq[range(n/2)] # one side frequency range

    Y = fft(y)/n # fft computing and normalization
    Y = Y[range(n/2)]

    plot(frq,abs(Y),'r') # plotting the spectrum
    xlabel('Freq (Hz)')
    ylabel('|Y(freq)|')

Fs = 150.0;  # sampling rate
Ts = 1.0/Fs; # sampling interval
t = arange(0,30,Ts) # time vector

ff = 0.2;   # frequency of the signal
y = sin(2*pi*ff*t)
ff = 0.8;   # frequency of the signal
y = y + sin(2*pi*ff*t)

figure()
subplot(2,1,1)
plot(t,y)
xlabel('Time')
ylabel('Amplitude')
subplot(2,1,2)
plotSpectrum(y,Fs)
savefig('out1.png')

fL = 0.1
fH = 0.3
N = 33
n = np.arange(N)

hlpf = np.sinc(2 * fH * (n - (N - 1) / 2.))
hlpf *= np.blackman(N)
hlpf = hlpf / np.sum(hlpf)

# Compute a high-pass filter with cutoff frequency fL.
hhpf = np.sinc(2 * fL * (n - (N - 1) / 2.))
hhpf *= np.blackman(N)
hhpf = hhpf / np.sum(hhpf)
hhpf = -hhpf
hhpf[(N - 1) / 2] += 1

hp = np.convolve(hlpf, hhpf)
filtered = np.convolve(y, hp)

t2 = np.linspace(0,30.,len(filtered)) # time vector
figure()
subplot(2,1,1)
plot(t2, filtered)
xlabel('Time')
ylabel('Amplitude')
subplot(2,1,2)
plotSpectrum(filtered,Fs)
savefig('out2.png')
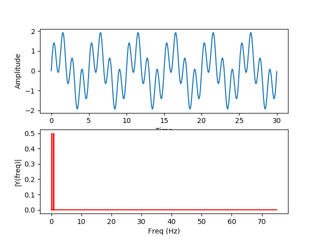
For the original signal:
I get an output like this:
To confirm I could filter this signal, I used a butterworth filter,
def butter_bandpass(lowcut, highcut, fs, order=5):
    nyq = 0.5 * fs
    low = lowcut / nyq
    high = highcut / nyq
    b, a = butter(order, [low, high], btype='band')
    return b, a


def butter_bandpass_filter(data, lowcut, highcut, fs, order=5):
    b, a = butter_bandpass(lowcut, highcut, fs, order=order)
    y = lfilter(b, a, data)
    return y

filtered = butter_bandpass_filter(y, fL, fH, Fs, order=2)
That worked fine (although I had to play around with the order a little bit, higher orders of this filter does not work either). What is wrong with the first filter?
Regards,


