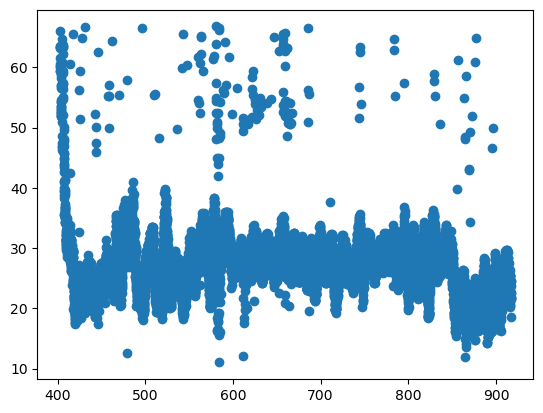
I have bivariate data representing the position of an identified reference point along a y axis which ranges from -100 to 100 mm. When I plot this data in a scatter plot I can see outliers and groups of wrongfully identified reference points. I know that since it is a spatial use case a continous track of points must exist along the x axis without large jumps in y. So using a computer vision algorithm I can identify a largest connected component with a very wide (large x component) and short (small y component) kernel using some erosion beforehand. However I dont know how to extract the information from the computer vision approach such that I can use it in my original data which is in x and y representing milimiters. The other alternative I am thinking about is using some sort of clustering or other type of (path) finding algorithm which could identify for me what the largest connected component horizontally wise is.
General Ideas are much appreciated.
I tried a largest connected component algorithm from opencv and some DBSCAN / OPTICS approaches. I expect a output which tells me which points are outliers, considering that outliers might even be denser point clouds based on the notion of one connected component going from start to end of my scatter plot. Thus I can remove these points from my bivariate data.
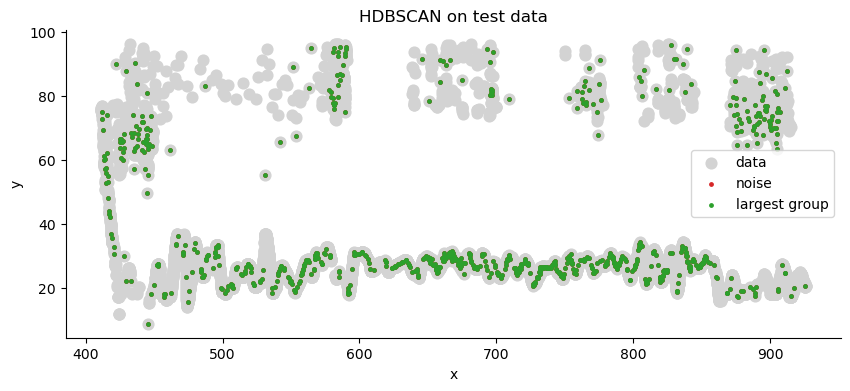
Maybe I do not understand HDBSCAN correctly, but the results are the same as with DBSCAN or Optics for me. The key is that my constraint is not only density but it also needs to span the entire x axis. HDBSCAN identifies over 30 what clusters and the largest cluster is noise. I tried several hyperparam choices, however I am not an expert on this
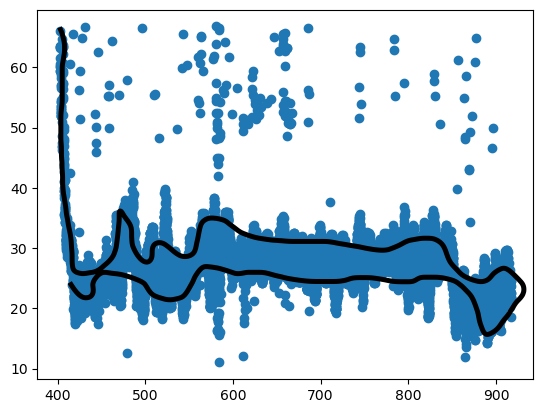
The Black marked area shows where the actual track is running along. I am fine with a certain uncertainty at the current stage I am at, so i marked the upper and lower boundaries of that track


mat,npzorcsvfile? $\endgroup$