Note: this question has been edited to refer to a sample that does not use dithering.
I recently asked my first question on here, about what I saw in an uncompressed audio file written out as integers. I learned about dithering.
This time, rather than silence, I'm examining a sine wave I generated. In Audacity, I generated a 700 Hz sine wave for 1 second, at amplitude 0.4. The bit rate is only 8000 samples per second.
I thought that when converted the 16-bit signed PCM mono WAVE audio to a list of 16-bit signed integers, that I would see a list of integers corresponding to the values I thought I'd see based on a simple calculation.
Here are the first 80 samples. Upon manual inspection, I found there to be a period of 80 samples, so these 80 samples just repeat:
 1.      0       41.      0
 2.   6592       42.  -6848
 3.  11423       43. -11679
 4.  13067       44. -13323
 5.  10604       45. -10860
 6.   4760       46.  -5016
 7.  -2306       47.   2050
 8.  -8768       48.   8512
 9. -12466       49.  12210
10. -12745       50.  12489
11.  -9524       51.   9268
12.  -3060       52.   2804
13.   3794       53.  -4050
14.   9711       54.  -9967
15.  12690       55. -12946
16.  12109       56. -12365
17.   7704       57.  -7960
18.   1028       58.  -1284
19.  -6207       59.   5951
20. -11176       60.  10920
21. -13363       61.  13107
22. -11176       62.  10920
23.  -6207       63.   5951
24.   1028       64.  -1284
25.   7704       65.  -7960
26.  12109       66. -12365
27.  12690       67. -12946
28.   9711       68.  -9967
29.   3794       69.  -4050
30.  -3060       70.   2804
31.  -9524       71.   9268
32. -12745       72.  12489
33. -12466       73.  12210
34.  -8768       74.   8512
35.  -2306       75.   2050
36.   4760       76.  -5016
37.  10604       77. -10860
38.  13067       78. -13323
39.  11423       79. -11679
40.   6592       80.  -6848
Based on the Nyquist frequency (4000 Hz), I calculated the values that I expected to see when I opened the file:
$v(n)=aM \sin\left({\dfrac{n\pi f_\mathrm{data}}{f_\mathrm{Nyquist}}}\right)$
$v(n)$ is the value of the sample written out as a 16-bit signed integer
$a$ is the amplitude of the sine wave (here, it is 0.4)
$M$ is the maximum possible value written out as a 16-bit signed integer (here, it is 32,767)
$n$ is the index of the sample (the first sample has an index of 0, the next is 1, etc.)
$f_\mathrm{data}$ is the frequency of the sine wave (here, it is 700)
$f_\mathrm{Nyquist}$ is the Nyquist frequency of the signal (here, it is 4000)
According to the above formula, I thought I would see these as the first 12 samples instead. Note: due to rounding/truncating, the program I used to tabulate these values differs from the formula above by [-1, +1].
 1.      0       41.      0
 2.   6848       42.  -6848
 3.  11678       43. -11678
 4.  13066       44. -13066
 5.  10603       45. -10603
 6.   5015       46.  -5015
 7.  -2050       47.   2050
 8.  -8512       48.   8512
 9. -12465       49.  12465
10. -12744       50.  12744
11.  -9267       51.   9267
12.  -3059       52.   3059
13.   4050       53.  -4050
14.   9966       54.  -9966
15.  12945       55. -12945
16.  12109       56. -12109
17.   7703       57.  -7703
18.   1028       58.  -1028
19.  -5950       59.   5950
20. -11175       60.  11175
21. -13106       61.  13106
22. -11175       62.  11175
23.  -5950       63.   5950
24.   1028       64.  -1028
25.   7703       65.  -7703
26.  12109       66. -12109
27.  12945       67. -12945
28.   9966       68.  -9966
29.   4050       69.  -4050
30.  -3059       70.   3059
31.  -9267       71.   9267
32. -12744       72.  12744
33. -12465       73.  12465
34.  -8512       74.   8512
35.  -2050       75.   2050
36.   5015       76.  -5015
37.  10603       77. -10603
38.  13066       78. -13066
39.  11678       79. -11678
40.   6848       80.  -6848
The difference is much more than the [-7, +7] that I found in the scenario mentioned in my previous question.
In examining the differences between the values, I found this:
 1.      0       41.      0
 2.    256       42.      0
 3.    255       43.      1
 4.     -1       44.    257
 5.     -1       45.    257
 6.    255       46.      1
 7.    256       47.      0
 8.    256       48.      0
 9.      1       49.    255
10.      1       50.    255
11.    257       51.     -1
12.      1       52.    255
13.    256       53.      0
14.    255       54.      1
15.    255       55.      1
16.      0       56.    256
17.     -1       57.    257
18.      0       58.    256
19.    257       59.     -1
20.      1       60.    255
21.    257       61.     -1
22.      1       62.    255
23.    257       63.     -1
24.      0       64.    256
25.     -1       65.    257
26.      0       66.    256
27.    255       67.      1
28.    255       68.      1
29.    256       69.      0
30.      1       70.    255
31.    257       71.     -1
32.      1       72.    255
33.      1       73.    255
34.    256       74.      0
35.    256       75.      0
36.    255       76.      1
37.     -1       77.    257
38.     -1       78.    257
39.    255       79.      1
40.    256       80.      0
A negative number indicates that the actual value is lower than I expected, and vice versa.
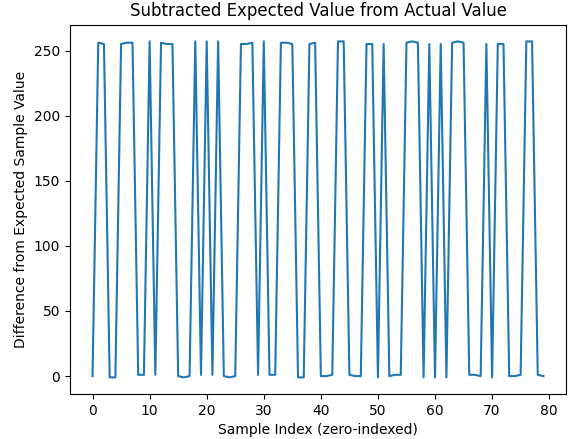
Here is the difference as a graph:
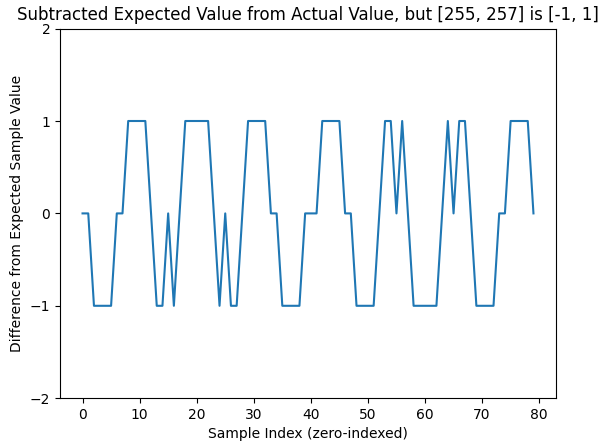
It's kind of hard to read due to the scale, so here is a provisional graph where [255, 257] is mapped to [-1, 1]:
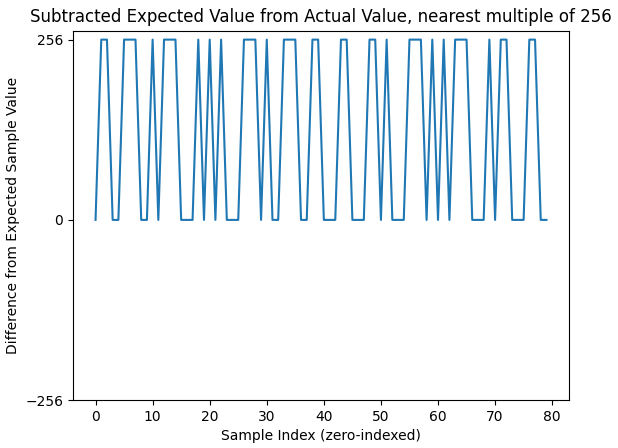
And here is a graph denoting which samples are offset:
Surely, this can't be dithering if I turned it off.
Again, the [-1, +1] is probably rounding/truncating in going from a floating-point type to an integer type. So what is the 256 there for?
More saliently, if I were to generate a sine wave from a list of integers ab initio, but didn't do this weird 256 stuff, would there be any issues due to those not being there?
For context, I can convert between 16-bit signed PCM WAVE audio and 16-bit signed integers bidirectionally. I'm using uncompressed audio right now to work out these kinds of issues. My end goal is some kind of embedded systems application, hence the desire to examine things at a numerical level. Before I switch to compressed audio, I want to ensure that every possible feature works with uncompressed audio because I can easily read it.


