One measure you may use is the Entropy (Information Theory) of the data.
Its definition is given by:
$$ H \left( X \right) := - \sum_{x \in \mathcal{X}} p \left( x \right) \log p \left( x \right) = \mathbb{E} \left[- \log p \left( X \right) \right] $$
So we need to deal with 2 things:
- Calculate the histogram of the image.
- Deal with the multiple channels.
A simple way would be calculating the entropy on each channel (RGB) then average the result. Yet this won't take into account the actual color space.
One could even use different color space, like calculating the entropy of the luminance or the hue channels in HSL model.
One way to treat each pixel as a vector in space would be converting the image into 8 Bit / Channel space and then create an histogram for 24 Bit numbers (Usually using UINT32 / INT32).
Then calculate the entropy on this histogram.
MATLAB Code
The function to calculate the entropy is given by:
function [ imgEntropy ] = CalcImgEntropy( mI, entropyMode )

FALSE   = 0;
TRUE    = 1;

OFF     = 0;
ON      = 1;

ENTROPY_MODE_CHANNEL    = 1; %<! Averages per channel calculation
ENTROPY_VECTOR          = 2; %<! Treats the RGB data as a single vector per pixel

numRows     = size(mI, 1);
numCols     = size(mI, 2);
numChannels = size(mI, 3);

if(numChannels > 8)
    % 8 channels of `uint8` can be packed into `uint64`
    error('Input Image Must Have # Channels < 8');
end

if(numChannels == 1)
    imgEntropy = CalcEntropy(mI);
else
    if(entropyMode == ENTROPY_MODE_CHANNEL)
        imgEntropy = 0;
        for ii = 1:numChannels
            imgEntropy = imgEntropy + CalcEntropy(mI(:, :, ii));
        end
        imgEntropy = imgEntropy / numChannels;
    elseif(entropyMode == ENTROPY_VECTOR)
        if(numChannels > 4)
            mI = uint64(mI);
        else
            mI = uint32(mI);
        end
        mD = mI(:, :, 1);
        for ii = 2:numChannels
            mD = mD + bitshift(mI(:, :, ii), 8 * (ii - 1));
        end
        imgEntropy = CalcEntropy(mD(:));
    end
end


end


function [ valEntropy ] = CalcEntropy( vI )

vU = unique(vI(:));
vP = histc(vI(:), vU);

vP = vP / sum(vP); %<! Make it probability

valEntropy = -sum(vP .* log2(vP));

end
As one can see, for the "vector" case the function packs each 8 but channel into a longer representation. Then it calculates the entropy.
The results I get:

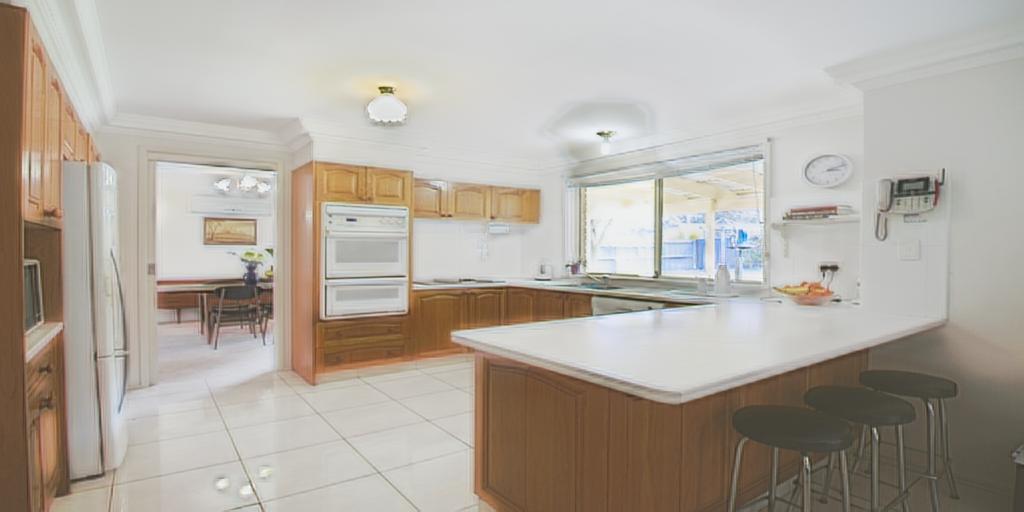
Where Image 001 is given by:

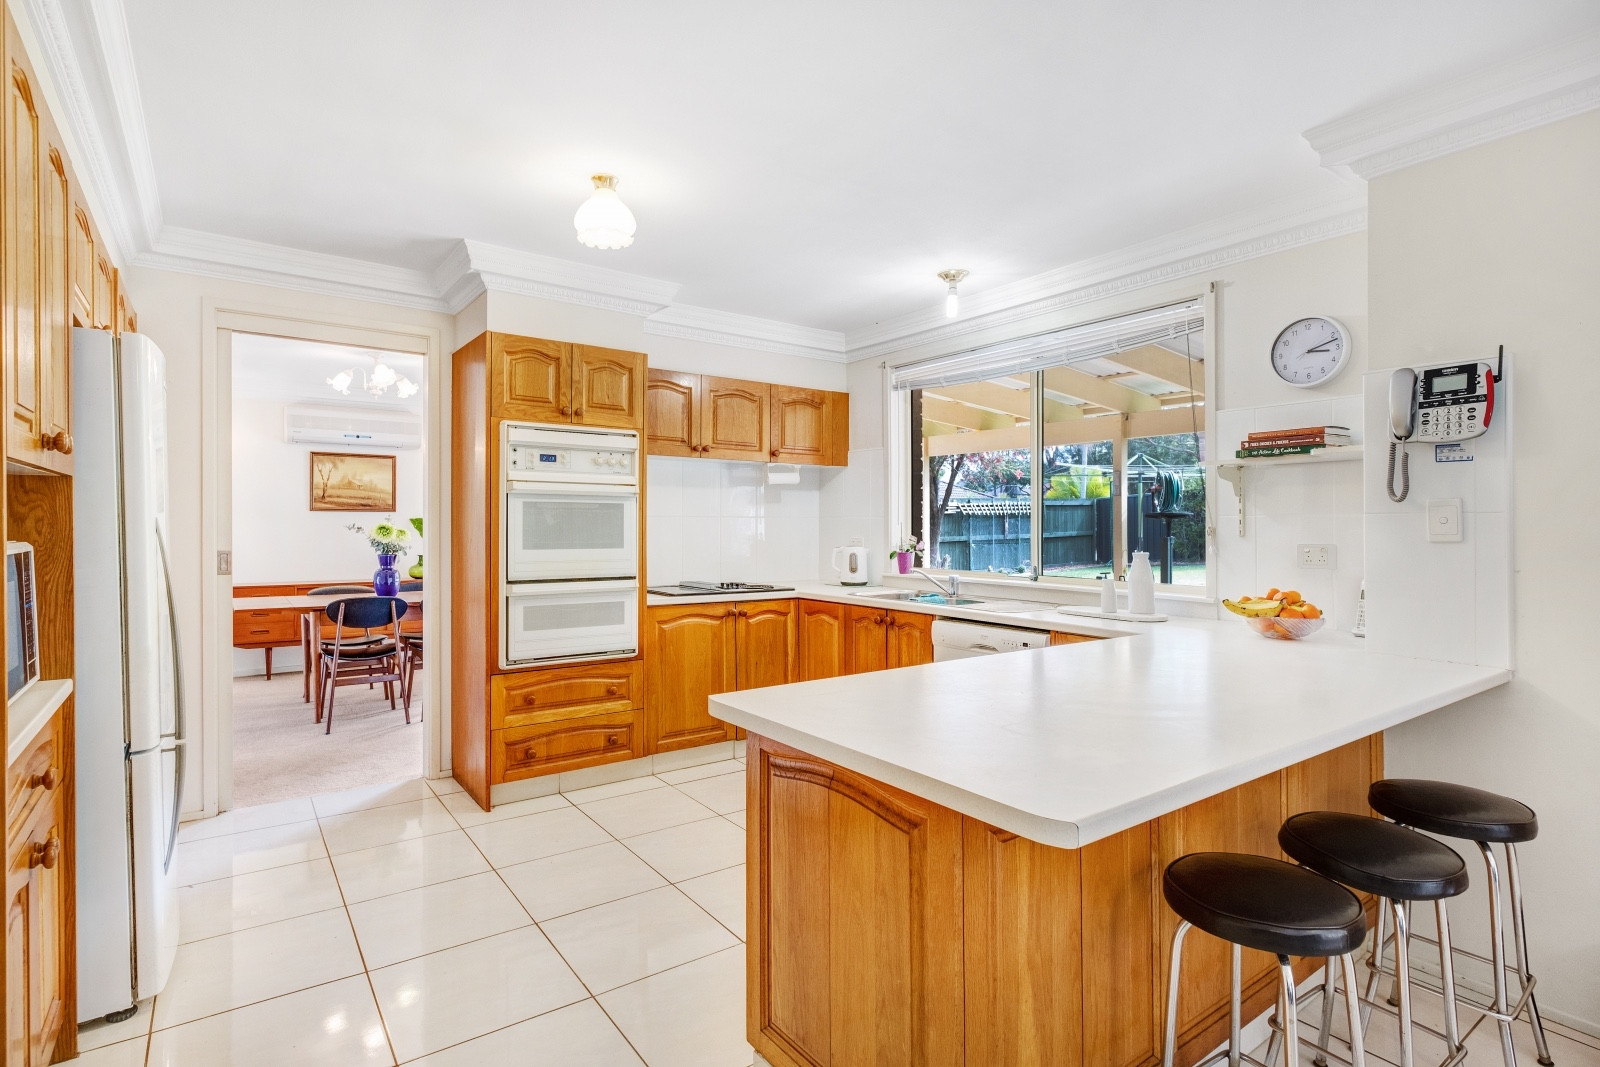
Image 002 is given by:

Indeed the entropy of the 2nd image is higher which means it has more colors and its histogram is more uniform.
The full code is available on my StackExchange Signal Processing Q84826 GitHub Repository (Look at the SignalProcessing\Q84826 folder).
Update
I also added a Julia code to implement the above (Same location).


