4
$\begingroup$

I am looking to compare the color depth of multiple images, in order to see which one has the best color depth. I was wondering what is the best way to compute color depth computationally?

I've seen something called bit depth used to measure color depth, however that doesn't seem totally right...

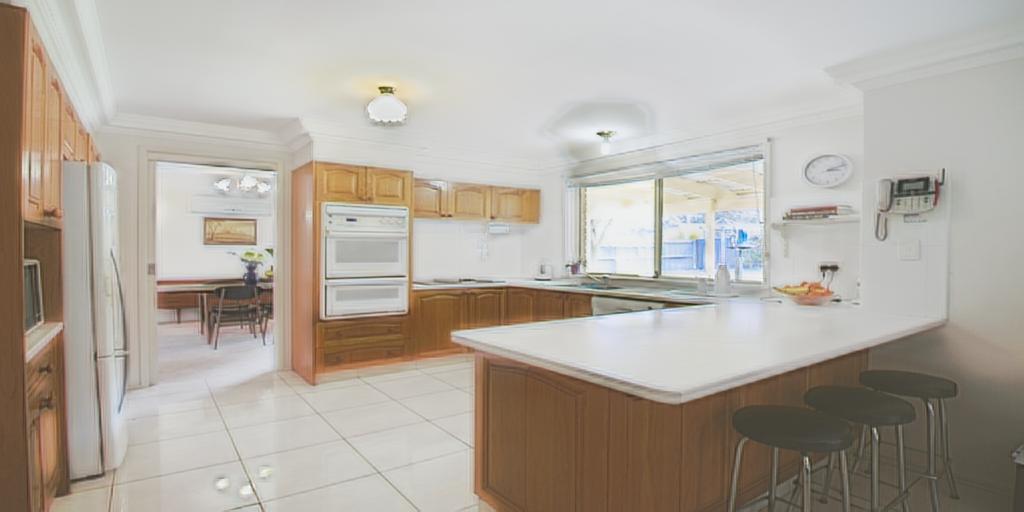
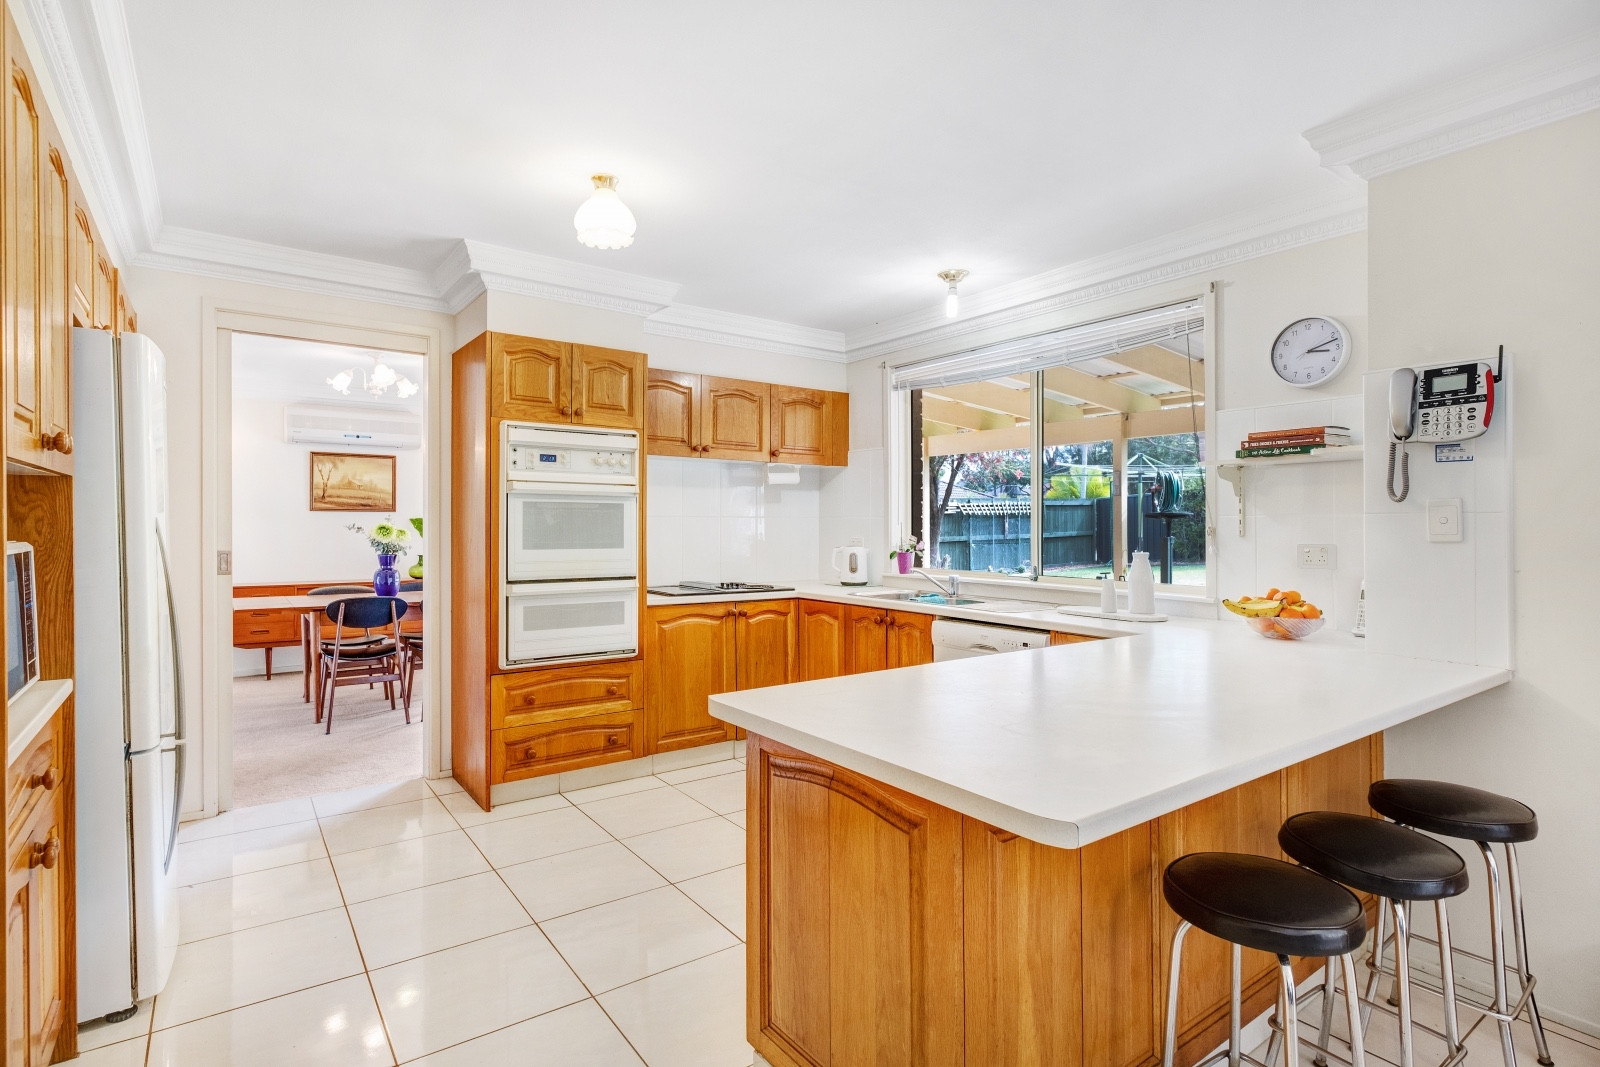
Like between these 2 images,

interior 1

interior 2

The second image has better color depth, but from the image details I saw both of the bit depth are 24. So is there a way to measure color depth or measure of the color space which then would in a way show that the second image's color depth is better than the first?

$\endgroup$

4 Answers 4

1
$\begingroup$

One measure you may use is the Entropy (Information Theory) of the data.
Its definition is given by:

$$ H \left( X \right) := - \sum_{x \in \mathcal{X}} p \left( x \right) \log p \left( x \right) = \mathbb{E} \left[- \log p \left( X \right) \right] $$

So we need to deal with 2 things:

  1. Calculate the histogram of the image.
  2. Deal with the multiple channels.

A simple way would be calculating the entropy on each channel (RGB) then average the result. Yet this won't take into account the actual color space.

One could even use different color space, like calculating the entropy of the luminance or the hue channels in HSL model.

One way to treat each pixel as a vector in space would be converting the image into 8 Bit / Channel space and then create an histogram for 24 Bit numbers (Usually using UINT32 / INT32). Then calculate the entropy on this histogram.

MATLAB Code

The function to calculate the entropy is given by:

function [ imgEntropy ] = CalcImgEntropy( mI, entropyMode )

FALSE   = 0;
TRUE    = 1;

OFF     = 0;
ON      = 1;

ENTROPY_MODE_CHANNEL    = 1; %<! Averages per channel calculation
ENTROPY_VECTOR          = 2; %<! Treats the RGB data as a single vector per pixel

numRows     = size(mI, 1);
numCols     = size(mI, 2);
numChannels = size(mI, 3);

if(numChannels > 8)
    % 8 channels of `uint8` can be packed into `uint64`
    error('Input Image Must Have # Channels < 8');
end

if(numChannels == 1)
    imgEntropy = CalcEntropy(mI);
else
    if(entropyMode == ENTROPY_MODE_CHANNEL)
        imgEntropy = 0;
        for ii = 1:numChannels
            imgEntropy = imgEntropy + CalcEntropy(mI(:, :, ii));
        end
        imgEntropy = imgEntropy / numChannels;
    elseif(entropyMode == ENTROPY_VECTOR)
        if(numChannels > 4)
            mI = uint64(mI);
        else
            mI = uint32(mI);
        end
        mD = mI(:, :, 1);
        for ii = 2:numChannels
            mD = mD + bitshift(mI(:, :, ii), 8 * (ii - 1));
        end
        imgEntropy = CalcEntropy(mD(:));
    end
end


end


function [ valEntropy ] = CalcEntropy( vI ) 

vU = unique(vI(:));
vP = histc(vI(:), vU);

vP = vP / sum(vP); %<! Make it probability

valEntropy = -sum(vP .* log2(vP));

end


As one can see, for the "vector" case the function packs each 8 but channel into a longer representation. Then it calculates the entropy.

The results I get:

enter image description here

Where Image 001 is given by:

enter image description here

Image 002 is given by:

enter image description here

Indeed the entropy of the 2nd image is higher which means it has more colors and its histogram is more uniform.

The full code is available on my StackExchange Signal Processing Q84826 GitHub Repository (Look at the SignalProcessing\Q84826 folder).

Update

I also added a Julia code to implement the above (Same location).

$\endgroup$
0
$\begingroup$

Since both images are stored using a format with the same bit depth then, I believe that you want to know the total amount of colors used.

Using pseudo-code, it would be something like

my_image = array(x,y)
colors = array(bit depth)

for m = 0 to x
   for n = 0 to y
      int rgb = red[m,n]
      rgb = (rgb << 8) + green[m,n]
      rgb = (rgb << 8) + blue[m,n]
      colors[rgb]+=1

to provide an individual color count. Then you can compare both images, for example, or just sum up everything.

You might also be interested in color contrast, which is calculated based on the luminance channel.

$\endgroup$
0
$\begingroup$

It is not clear what you want, but from those two images it seems to me that what you want to measure is color saturation.

From an sRGB representation you probably can do a decent score based on the deviation of [r,g,b] from their (possibly weighted) mean.

$\endgroup$
0
$\begingroup$

You got apparently working answer, but let me provide another view. Instead of working in RGB you can study the image in HSV color model. In HSV "S" stands for saturation and it seems you are interested in that.

In octave we can load the image in HSV and study the mean

>> firstIM = imread("C95vE.jpg");
>> secondIM = imread("mYxDD.jpg");
>> firstIMHSV = rgb2hsv(firstIM);
>> secondIMHSV = rgb2hsv(secondIM);
>> firstSaturation = firstIMHSV(:,:,2);
>> secondSaturation = secondIMHSV(:,:,2);
>> mean(firstSaturation(:))
ans = 0.1997
>> mean(secondSaturation(:))
ans = 0.1365

Here the saturation means the "amount of grey" thus lower value means more saturated colors. Of course you can use other measure than mean here.

$\endgroup$

Your Answer

By clicking “Post Your Answer”, you agree to our terms of service and acknowledge you have read our privacy policy.

Not the answer you're looking for? Browse other questions tagged or ask your own question.