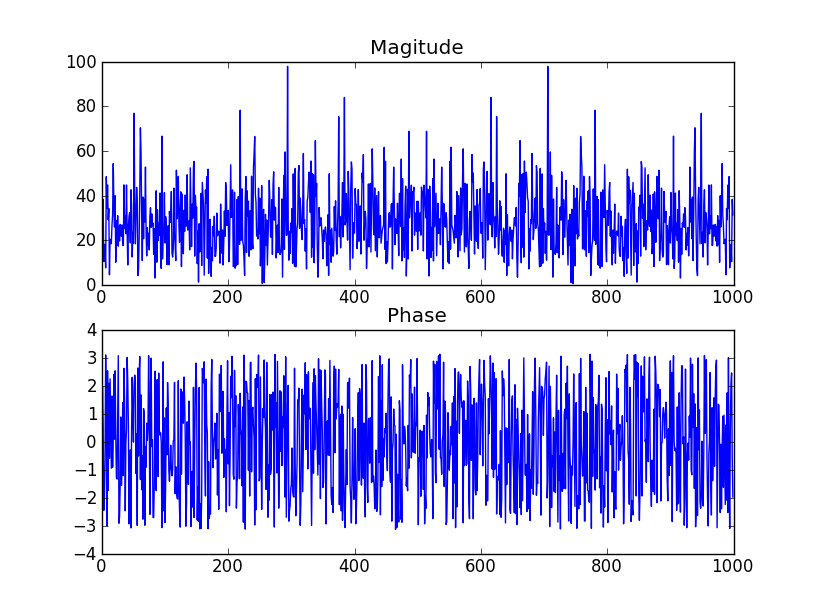
Isn't white noise supposed to have a flat magnitude response?
(equal amounts for all frequencies)
The expected magnitude response of white noise is flat (this is what JasonR calls the power spectral density). Any particular instance of a white noise sequence will not have precisely flat response (this is what JasonR's comment refers to as the power spectrum).
In fact, the Fourier transform of white noise is... white noise!
What is the relationship between the standard deviation
(1 in my example) and the magnitude and phase?
There will be no relationship between the standard deviation and the phase. As for the magnitude, suppose $n(t)$ is stationary white noise with zero mean and standard deviation $\sigma$. Then the autocorrelation (covariance) is:
$$
R_{nn}(\tau) = E[n(t)n(t+\tau)] = \sigma^2\delta(\tau)
$$
So the power spectral density is just $\sigma^2$ (though for discrete-time, there will be a scaling based on the duration of the signal).
Questions from comment:
- When you say that the Fourier transform is also white noise,
how can I measure the std-dev when the transform is complex? Real,
imaginary part or some combination?
Assume that our noise is discrete-time and is $n[m]$ (zero mean, Gaussian, white noise with variance $\sigma^2$). Then the transform is:
$$
\begin{eqnarray}
N[k] &=& \sum_{m=0}^{M-1} n[m] e^{-j2\pi mk/M} \\
&=& \sum_{m=0}^{M-1} n[m] \cos(2\pi mk/M) + j n[m] \sin(2\pi mk/M)
\end{eqnarray}
$$
and the expected value is:
$$
\begin{eqnarray}
E\left[N[k]\right] &=& E\left[\sum_{m=0}^{M-1} n[m] e^{-j2\pi mk/M} \right]\\
&=& \sum_{m=0}^{M-1} E\left[n[m]\right] e^{-j2\pi mk/M} \\
&=& 0
\end{eqnarray}
$$
The variance of the real part is given by:
$$
\begin{eqnarray}
E\left[ (\Re N[k])^2 \right] &=& E \left [ \sum_{m=0}^{M-1} n[m] \cos(2\pi mk/M) \cdot \sum_{p=0}^{M-1} n[p] \cos(2\pi pk/M) \right ]\\
&=& E\left[ \sum_{m=0}^{M-1} \sum_{p=0}^{M-1} n[m]n[p] \delta[n-p] \cos(2\pi mk/M)\cos(2\pi pk/M) \right]\\
&=& \sum_{m=0}^{M-1} E\left[ n[m]^2 \right]\cos^2(2\pi mk/M)\\
&=& \sigma^2\sum_{m=0}^{M-1} \cos^2(2\pi mk/M)\\
&=& \sigma^2 \left( \frac{M}{2} + \frac{\cos(M+1) 2\pi k/M \sin(2\pi Mk/M) }{ 2 \sin (2\pi k/M) } \ \ \ \right)\\
&=& \frac{\sigma^2 M}{2}
\end{eqnarray}
$$
I believe the imaginary part will behave the same way.
- Could you please enlighten me how the duration of the signal relates
to the power spectral density (for discrete time situations)
I believe that (based on the above derivation), the power spectral density (the expected value of the square of the DFT) will scale linearly as the duration.
- If the phase is not affected by the std-dev, what determines the 3 degree amplitude, and the type of distribution (seems to be uniform rather than normal)
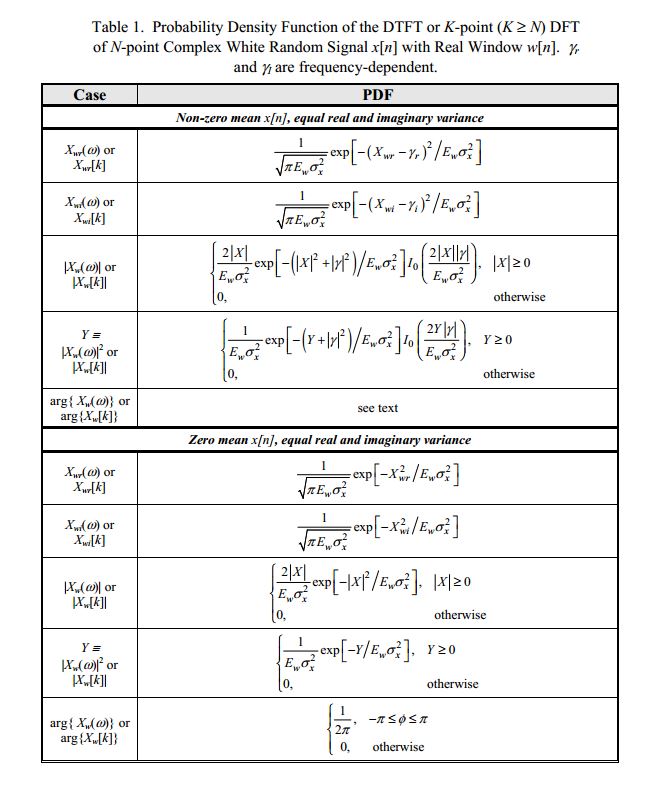
Check out the table on page 2 of this PDF file. it says that the argument (phase) of the coefficients will be uniformly distributed, as you state. Screenshot of the table included below.

 Questions:
