0
$\begingroup$

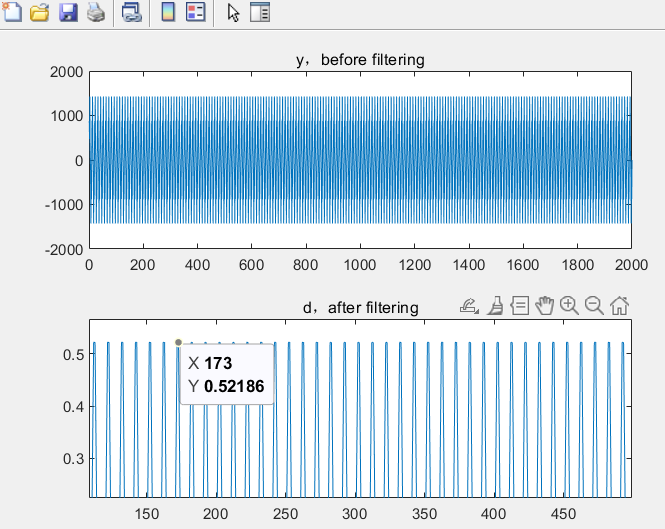
Before quantization of filter coefficient, it behaves well, but after quantization the amplitude drops to 0.52186, which is expected to be 1000(fig.1). But according to the amplitude response in filterDesigner(fig.2). The 200Hz wave shouldn't decrease so much after filtering. Could someone tell me why the abnormal attenuation happens? Why is it 0.52186?
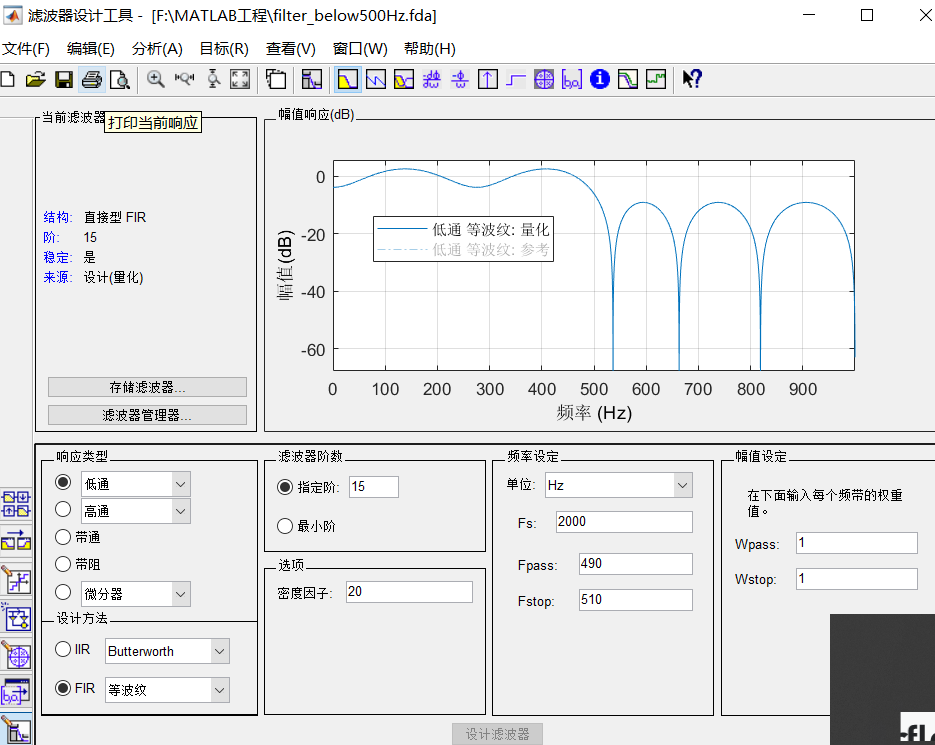
Fig.1 effect of filter Fig.1 effect of filter

Fig.2 amplitude response Fig.2 amplitude response

Matlab code is as follows

N = 2000;
    f0=200;
    f1=800;
    fs=2000;
    n=1:N;
    y =1000*sin(2*pi*f0.*n/fs)+500*sin(2*pi*f1.*n/fs);
    Hd = filter_below500Hz;
    d = filter(Hd,y);
    figure(2)
    subplot(2,1,1)
    plot(y);
    title({['y,before filtering']});
    subplot(2,1,2)
    plot(d);
    title({['d,after filtering']});
$\endgroup$
3
  • $\begingroup$ Unrecognized function or variable filter_below500Hz $\endgroup$
    – ZR Han
    Commented Jul 14, 2022 at 5:50
  • $\begingroup$ What is unclear to me, are you looking at the frequency response of the floating point coefficients of your filter or at the frequency response of the filter with quantized coefficients? $\endgroup$ Commented Jul 14, 2022 at 8:57
  • $\begingroup$ That is indeed very wrong. But we need to see the filter coefficients themselves and the actual process how you quantize them. $\endgroup$
    – Hilmar
    Commented Jul 14, 2022 at 14:02

0

Your Answer

By clicking “Post Your Answer”, you agree to our terms of service and acknowledge you have read our privacy policy.

Browse other questions tagged or ask your own question.