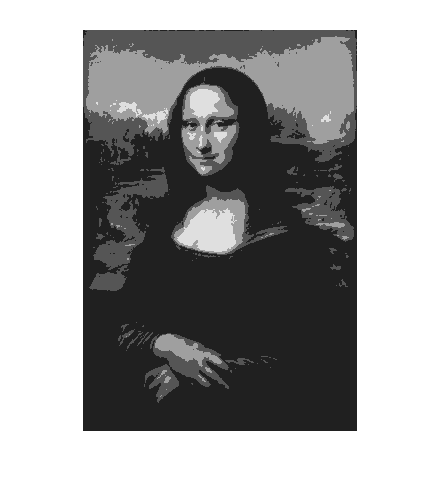
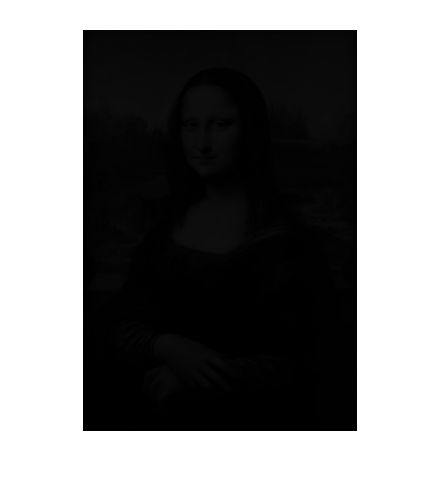
I point you to this https://stackoverflow.com/questions/12723699/changing-image-bit-depth-using-matlab it can be done. This particular post is only for png, but if I'm not mistaken all image types have the depth parameter so they can likely all be changed in a similar manner
EDIT
For your particular problem, since your images are already grayscale you would do something like
%change this as needed
desired_bit_depth = 2;

my_pixel_depth = 2 ^ desired_bit_depth;
%converts grayscale to an indexed image at the appropriate depth
[ind_im, reduced_colormap ] = gray2ind(my_gray_image, my_pixel_depth)

%displays your new image
figure()
subplot(1,2,1);imshow(my_gray_image); title('original')
subplot(1,2,2);imshow(ind_im,reduced_colormap); title(sprintf('reduced to %d bits',desired_bit_depth))

% save indexed png
imwrite(ind_im, reduced_colormap, 'test.png', 'bitdepth', desired_bit_depth);
EDIT #2: While reducing the "bits" to display the image, the "colormap" is made by taking the average of each range
I kept the original answer because it still works and may suit someone elses needs in the future.
For this solution, rather than using evenly spaced values for our "colormap' we actually use the gray value that is the average over the specified range
ex
to convert to 1 bit image we have two ranges 0,128 and 128,256
replace all values between 0,128 with the average value between 0,128
replace all values between 128,256 with the average value between 128,256
function result_im = ChangeBitDepthGrayImage(gray_im, desired_bit_depth)
    if (desired_bit_depth < 1)
        disp('converting to binary(1 bit) image');
        desired_bit_depth = 1;
    end

    if (desired_bit_depth > 8)
        disp('converting to 8 bit image');
        desired_bit_depth = 8;
    end

    %assuming we start with 8 bit image 256 levels
    num_levels = 2 ^ desired_bit_depth;

    %figures out how big each range should be, we use +1 because if we
    %divide the data into N levels, there should be N+1 boundaries
    limits = linspace(0,256,num_levels + 1);

    result_im = uint8(zeros(size(gray_im)));

    for i = 1:num_levels
        lower_lim = limits(i);
        upper_lim = limits(i+1);

        %creates a binary mask of values between the limits, the output is
        %0 or 1, but we need to make it uint8 for the next step
        temp_mask = uint8((gray_im >= lower_lim) & (gray_im < upper_lim));

        %multiplies image by mask, this isolates only pixels in the given
        %range
        image_only_in_range = temp_mask .* gray_im;

        %finds the mean of that small part of the image. this weird notation is
        %taking the average of nonzero elements
        avg_val_for_range = round(mean(image_only_in_range(image_only_in_range~=0)));

        %replaces all pixels in that range with the average val
        result_im = result_im +(avg_val_for_range * temp_mask);
    end


    %i just picked some random figure
    figure(32)
    subplot(1,2,1);imshow(gray_im);title('original image');
    subplot(1,2,2);imshow(result_im);title(sprintf('modified to %dbit image',desired_bit_depth));
end


