3
$\begingroup$

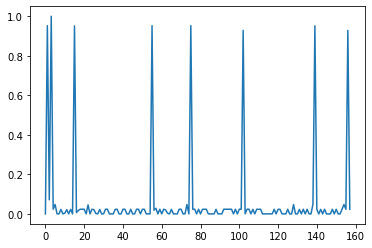
I am working on a problem that produces different types signals, and I need to detect the peaks after low-pass filtering, then find_peaks from scipy. For example, the one below:

enter image description here

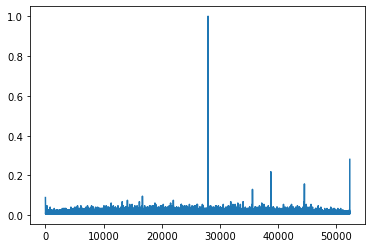
I am however faced with some signals that have an impulse shape, as in:

enter image description here

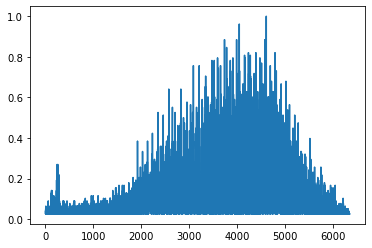
or,

enter image description here

Filtering such signals destroys the peaks' locations, and sometimes lead to merging two or more peaks into one. Thus, I am not able to extract the peaks correctly.

Is there a method to infer if the signal has impulses (a few to many spikes)? This would help me directly extract the peaks easily.

I highly appreciate any input.

$\endgroup$
2
  • $\begingroup$ So you have a signal comprised of peaks (which you want to detect). And your observation is a low-pass version? This can be called deconvolution, restoration, reconstruction... What other knowledge do you have? The response of the low-pass? $\endgroup$ Commented Apr 27, 2021 at 13:47
  • $\begingroup$ The graphs belong to 3 different signals, I need the indices of peaks. Using a low pass filter to smooth the data and to enable me detect the peaks. This works for the signal in the top graph, but it will do a terrible job when applied on a signal that has a few impulses, as shown in the mid and lower graphs. The low pass filter, F, is a simple averaging filter; implemented as a bank of increasing sizes N=[63, 127, 191]. That is, the signal filtered via F_63 is passed to F_127, and so on. If the signal has less than 500 points, I am using N=[7, 15, 31]. N the filter kernel size. $\endgroup$
    – Mohd
    Commented Apr 27, 2021 at 14:04

2 Answers 2

3
$\begingroup$

You can use kurtosis as a measure of how 'peaky' your signal is. Or the flatness measure, which is the ratio of the geometric mean of the signal to its arithmetic mean. Any signal which is not relatively flat will have a flatness value near 0.

$$\text{Flatness} = \frac{\sqrt[N]{\prod_{n=0}^{N-1} x(n)}}{\frac{1}{N} \sum_{n=0}^{N-1} x(n)}$$

$\endgroup$
6
  • $\begingroup$ I have upvoted your answer, I believe this is a correct direction. However, note that the geometric mean in the numerator is not so robust. A single zero value in the signal will give you a zero flatness, whatever the others $\endgroup$ Commented Apr 28, 2021 at 11:43
  • $\begingroup$ Thank you for your nice thoughts. I've tried both methods. Flatness leads to underflow (values <1), or overflow if I use the non normalized (to 1) signal. To my surprise, Kurtosis gave incorrect results. I am trying something that might work, and will update the question, or provide an answer based on the solution. $\endgroup$
    – Mohd
    Commented Apr 28, 2021 at 12:45
  • $\begingroup$ @LaurentDuval I think what's making it problematic to use kurtosis is the variant length of signals. Nonetheless, here's what I think worked for my case, I am calling it impulse probability, the closer the value to 1 means the signal has an impulse shape. I'm basically counting the number of points above mean+std, and then finding the signal mean of those counted points. Here's how I did it impulse_prob = x[ x> ( x.mean()+x.std() ) ].mean(). I can provide detailed results, including both kurtosis and what I am suggesting. This measure may fail if the number of impulses is 1, or very high. $\endgroup$
    – Mohd
    Commented Apr 28, 2021 at 16:30
  • 1
    $\begingroup$ @LaurentDuval have tried the median and MAD, they failed to correctly detect a signal with four spikes, but the mean and std did well. For the four spikes signal with spike intensity close to 1, MAD=0, median = 6.5789e-05; but the mean=0.0018 and std=0.0403. Still, one way that I find useful (thought needs further investigation) is to amplify the signal before calculating the impulse_prob. I used x = exp(8*x) and the primary results seem good. Not yet sure as I need to test more signals. The dark side of this is loosing prob=1, but this can be resolved by max normalization after exp. $\endgroup$
    – Mohd
    Commented Apr 29, 2021 at 9:47
  • 1
    $\begingroup$ OK, that is good news if you have a workout; A MAD of zero means that more that 50% for values are equal to the median, this is why I suggested a threshold. Keep us posted $\endgroup$ Commented Apr 29, 2021 at 10:52
2
$\begingroup$

This is a question that I have been pondering for a while. I have not obtained a clear solution yet, here are a couple of thoughts, towards metrics based on sparsity proxies and noise estimators. Anybody wanting to share ideas and elaborate this with me is welcome.

First, this is a type of "sand pile problem". A grain of sand does not make a pile. Two neither, and so on. But if you keep on adding grains, one day you will have a pile. The exact quantity $U$ at the limit is reach is surely uncertain. Now, suppose you already have a sand pile. Remove one grain. Still a pile. You would see the point. The exact quantity $L$ where the pile becomes some grains is unclear as well, and most probably $L\neq U$.

This story is there to remind us that some isolated peaks or impulse spikes might look isolated. Yet, combine sufficiently many peaks, and you will get a perfectly fine... any signal. Fitting a large number of fine Gaussians to a curve is a problem with many solutions, and I am not aware of a stable and robust algorithm to do that job. In a word, this is probably a continuum between isolated peaks and the top signal. A key to this issue resides for me in the notion of sparsity, or how well a signal is concentrated. The constraints in your problem are to me:

  • signals can be of different length (160, 6500, 50000), so you are looking for a length invariant metric,
  • peaks are positive, either with constant or decaying amplitude,
  • there could be a positive non-zero baseline level (see signal 1),
  • there could be some noise (positive amplitude as well).

To me, minimal ingredients required are related to the notion of sparsity: s

  • a positive threshold $\tau$, to account for background noise and offet,
  • a sparse metric, applied on $x_k^\tau=\max(x_k,\tau)-\tau$ (a kind of shrinkage).

The count measure $\ell_0$ should be the most appropriate sparsity metric. one can quotient it to the number of samples to get a length-invariant measure that would yield a percentage of "not-too-low" samples. It is however a bit sensitive to the threshold. The seminal paper Comparing Measures of Sparsity provided a useful comparison of different sparsity metrics, and ranked them when they satisfied some axioms. The Gini index came first, and this is an option for you. Other interesting metrics involved ratios of norms. They are quite interesting to me, as they were used in two of our contributions to sparse signals restoration (under noise and low-pass filtering). The works were SOOT and SPOQ: Euclid in a Taxicab: Sparse Blind Deconvolution with Smoothed ℓ1/ℓ2 Regularization and SPOQ ℓp-Over-ℓq Regularization for Sparse Signal Recovery Applied to Mass Spectrometry.

All the above is related to a classical bound inequality. Suppose that we have a signal $x$ of length $N$, with only $\ell_0(x)=S\le N$ non-zero samples, and $p\leq q$. Then:

$$\ell_q(x)\le\ell_p(x)\leq S^{\frac{1}{p}-\frac{1}{q}}\ell_q(x)$$

The nice thing about this inequality is that it is extremal: tThe bounds are met in interesting conditions. For the sparsest signal (only one non-zero sample), $$\ell_q(x)=\ell_p(x)$$ For the least $S$-support sparse signal (all ones on $S$ samples), then: $$\ell_p(x)= S^{\frac{1}{p}-\frac{1}{q}}\ell_q(x)$$

As $S$ is unknown, a quantity like:

$$ \left(\frac{\ell_p(x^\tau)}{\ell_q(x^\tau)}\right)^{\frac{qp}{q-p}}$$

could provide a rough estimate to how your signal is spiky.

Edit: the answer by @orchi_d is related: kurtosis and flatness are ratios related to $\ell_p$ norms or quasinorms.

$\endgroup$
1
  • 1
    $\begingroup$ Thank you for the nice thoughts that summarized my struggle. The different length (160, 6500, 50000) also affects the filter bank I'm using. In some cases, a 5,000-point signal and another signal spanning more than 80,000 points may have a similar appearance. In addition, the solution has to be efficient and will thus check the Flatness and investigate what threshold value to use. $\endgroup$
    – Mohd
    Commented Apr 28, 2021 at 11:35

Your Answer

By clicking “Post Your Answer”, you agree to our terms of service and acknowledge you have read our privacy policy.

Not the answer you're looking for? Browse other questions tagged or ask your own question.