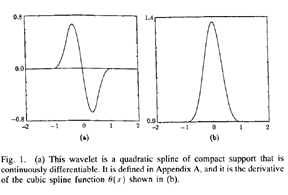
I am trying to use the discrete wavelet transform for signal processing (time series data from a plant). I would like to use a mother wavelet that is not in Matlab. Mallat and Zhong 1992 described a nonorthogonal quadratic spline wavelet I would like to use. They name some coefficients and impulse responses, but I'm not sure how to use these (reference below). To detect and treat abnormal sudden changes, the wavelet must satisfy a very particular property. We call a smoothing function any function θ(x) whose integral is equal to 1 and that converges to 0 at infinity. This function must be twice differentiable and define ψ_1 the first order derivative and ψ_2 the second order derivative.
ψ_1=(dθ(x))/dx and ψ_2=(d^2 θ(x))/(dx^2 )
The wavelet transform is computed by convolving the signal function f with a wavelet function (dilated at a scale s).
W_s^1 f(x)=fψ_(1,s) (x) and W_s^2 f(x)=fψ_(2,s) (x)
The extrema points of the first wavelet transform (WT) gives us the zero crossings points of the second WT. The extrema of W_s^1 f(x) and the zero-crossings of W_s^2 f(x) are the inflection points or the sharp variations points of f(x) smoothed by θ(x).Those edges in the signal can only be found if the wavelet is the second derivative of a smooth function. Furthermore, the first- and second-order WT are used in the detection of steady-state periods.
So I would like to code a quadratic spline wavelet function and a cubic spline scaling function like those in Mallat and Zhong (1992) article. Could anyone help me ?
Mallat, S., & Zhong, S. (1992). Characterization of Signals From Multiscale Edges. IEEE Transactions on Pattern Analysis and Machine Intelligence, 14(7), 710-732. doi:10.1109/34.142909

