0
$\begingroup$

I'm trying to analyze the following signal: My aim is to select the high-amlitude oscillation parts limited by the red stars. At the beginning, i have tried to set a threshold and keep only the upper parts. however,a part that the threshold depend on the signal itself, this method didn't work well and it allows the selection of the non desired parts. does anyone have another idea?
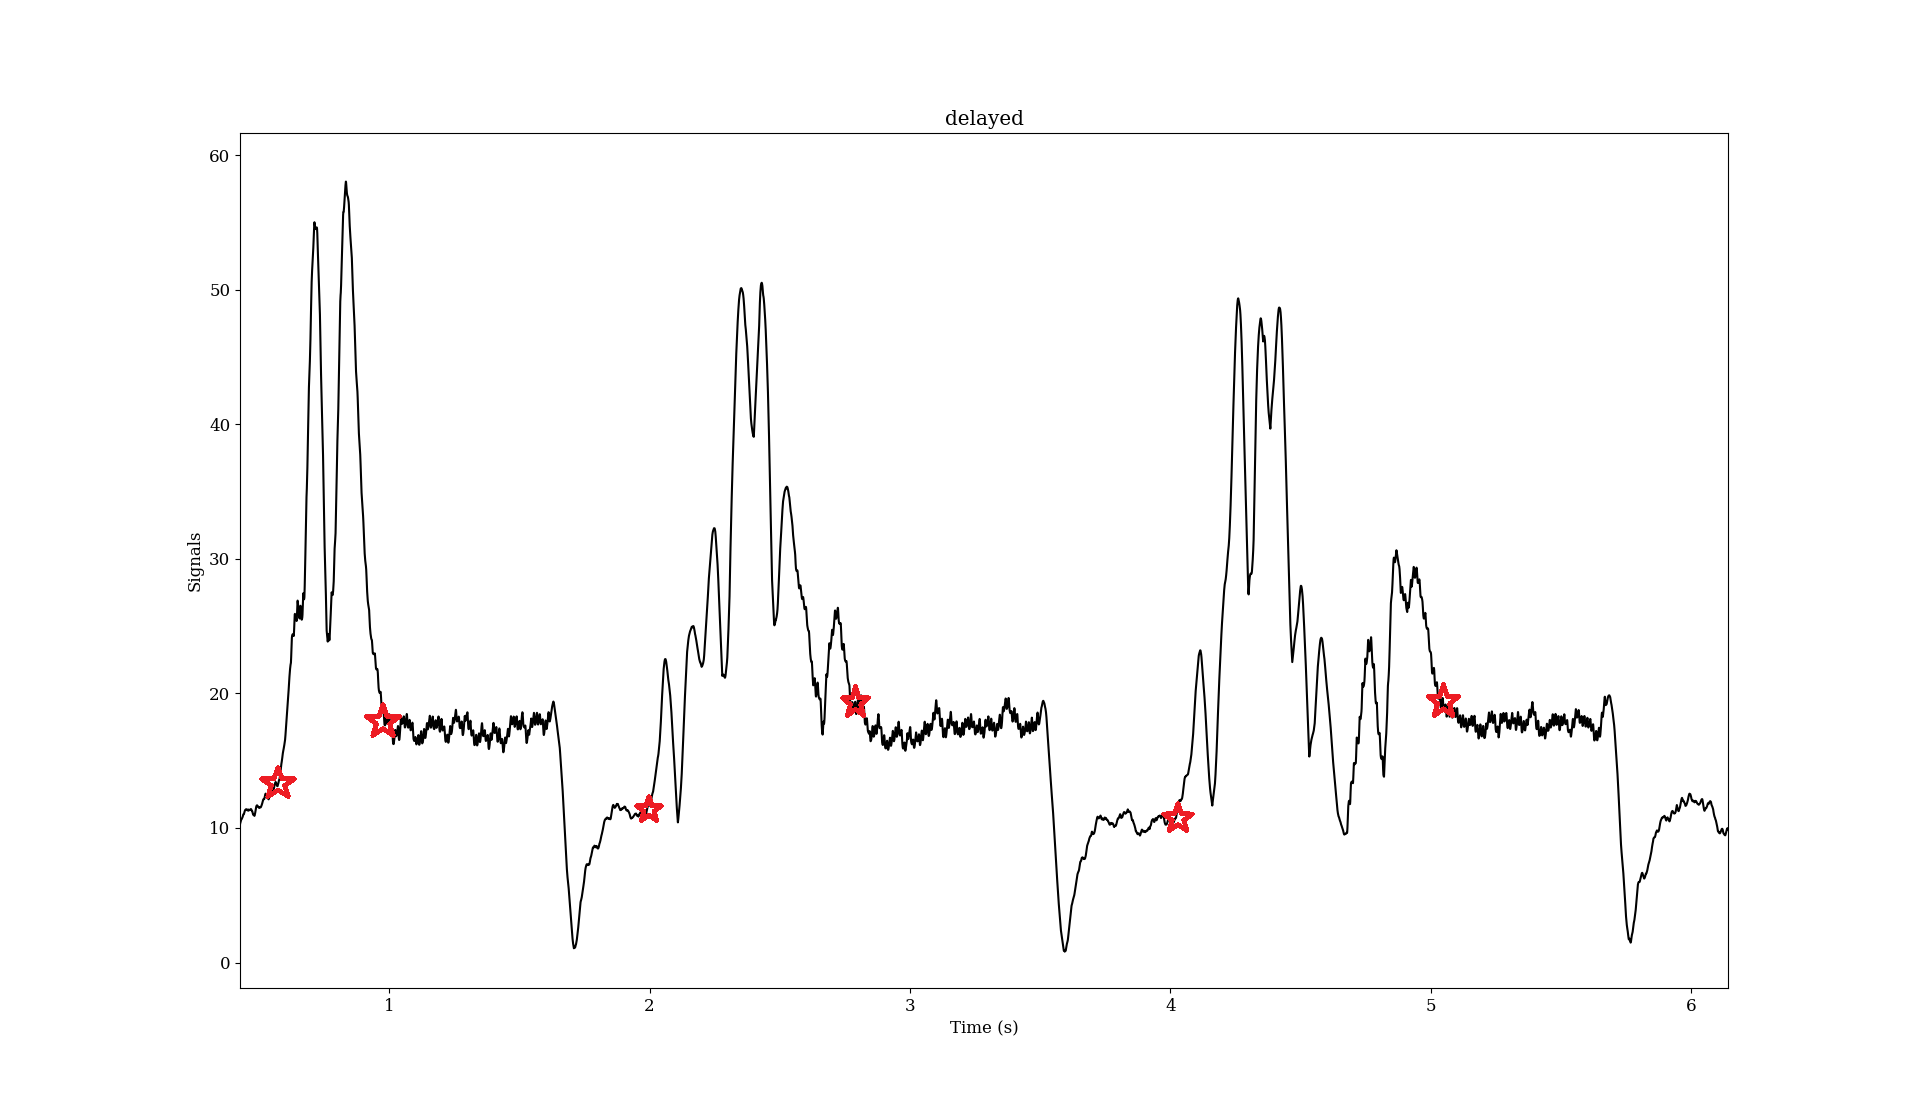
Thanks in advance.

$\endgroup$

4 Answers 4

1
$\begingroup$

By looking at that graph, it seems that simple math (or rather statistics) can be used to solve this problem. I'd divide (segment) your data into equal time frames and then compute the mean and possibly variance (or standard deviation) for each time frame.

The idea here is that the parts you're interested in will have a greater mean (and a greater variance) from the rest of the data. You'll still need a threshold, yes, but this approach is much more robust than just trying to compare the individual data points against the threshold.

For best results, you'll probably need to experiment a bit with different time frame lengths as well as different threshold values.

$\endgroup$
1
  • $\begingroup$ First, Thank you for the answer. this method would be effective only for this signal. I'm more looking for a general method that could work for all signal having the same patterns. $\endgroup$
    – Arrais
    Commented Apr 26, 2020 at 18:13
1
$\begingroup$

Take a morlet wavelet and run it over the entire signal. The frequency in the morlet wavelet can be set close to the frequency of these transitory regions. Even if not close to frequency of transition regions but still "matching more with the frequency of oscillatory regions than the flat regions would work, because we would be thresholding below. The width of the wavelet should be small enough because we are more interested in time localization here.

Once you do this wavelet convolution you will be left with a "cleaner" looking output with only places that have high oscillatory behaviour (close to the frequency of your wavelet) having high amplitudes in time. Then simply threshold the signal and consider only the outermost points of a clustered thresholded set of points (since all points in the oscillatory regions will be above the threshold) to detect transition points.

The threshold can be really close to zero if you have some prior idea about frequency of oscillatory regions (then you can set morlet wavelet freqeuency close to it). Otherwise, the threshold can be tuned based on the available signal dynamics.

$\endgroup$
2
  • $\begingroup$ First, thanks for the answer. I agree with you. applying a Morlet wavelet will lead towards a more cleaner signal (And I did it). However, we still need to fix a threshold that would be different for each signal of my data. The proposed process is a bit similat to what i did before when i used the python function "filtfilt" to make the signal smooth. $\endgroup$
    – Arrais
    Commented Apr 26, 2020 at 18:11
  • $\begingroup$ @Arrais, I think you can have set the maximum amplitudes of the morlet wavelet to 1 and have the dynamic range of the incoming signal decide the threshold I think 10% of dynamic range should be good enough. Let me know if that worked, I would be interested $\endgroup$ Commented Apr 26, 2020 at 18:21
0
$\begingroup$

Another perspective if the thresholding based on mean and variance (nice answer that) doesn't work. You could also try the Short Time Fourier Transform to identify the start and end of each oscillations. Its basically dividing your whole data into overlapping chunks and taking DFT of each chunk. The DFT of each chunk at time $m$ is $$ X[k,m]=\sum_{n=m}^{n=m+N}x[n]w[n]e^{-j2\pi kn/N} $$ where $k$ is the frequency index, $w$ is the $N$ point window. The overlap size if $L$. Looking at your time data, the oscillations seem to be $0.1s$ duration, so I would suggest a window length $N$ of $0.2s$ worth of samples. You can then identify the start and end times based on when the frequency corresponding to the oscillation frequency ($\approx 10Hz$) have large values compared to other frequency components. The unwanted frequency are more white noise like so they will be having nearly same values for all $k$ with low amplitude.

$\endgroup$
0
$\begingroup$

Maybe you can consider utilizing a bnadpass filter.

The lower cut-off frequency aims to generate a de-trend output signal. The higher cut-off frequency aims to filter out the ripple after each right red star in a cycle.

Zero phase delay technique like 'Filtfilt' can be utilized to guarantee there is no phase/delay distortion.

And then a basic peaks selection might fulfill your requirement. I guess.

In addition, in my experience, AMPD [1] often provides robust time domain peaks selection. Just for your reference.

[1] https://www.researchgate.net/publication/233735046_An_Efficient_Algorithm_for_Automatic_Peak_Detection_in_Noisy_Periodic_and_Quasi-Periodic_Signals

$\endgroup$

Your Answer

By clicking “Post Your Answer”, you agree to our terms of service and acknowledge you have read our privacy policy.

Not the answer you're looking for? Browse other questions tagged or ask your own question.