1
$\begingroup$

I have a noisy signal (Gaussian Noise) with a known SNR and known Noise variance. This signal contains a number of Frequency components. My ultimate objective is to detect the components of the signal. What is the Threshold formula should I use to detect the peaks of the signal in frequency domain given a certain Pfa (probability of false alarm)?

The following plot is an example of my objective. I want a Threshold that separates my useful components from the noise components (Let's say between 0.6 and 1)

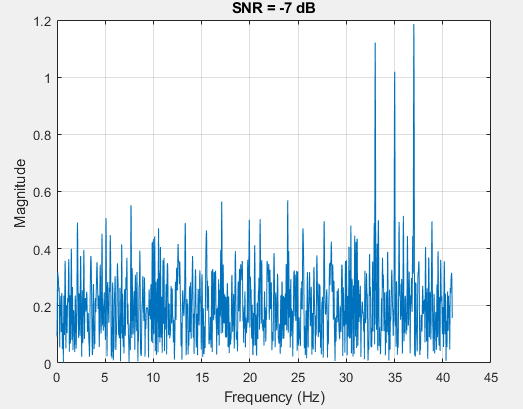
Example

$\endgroup$
2
  • $\begingroup$ It looks to me you can get rid of the noise by mirroring the spectrum about 20.5 Hz and subtracting. I suppose this is not actual data but a modeling artifact, say complex quadrature signal in real noise. $\endgroup$ Commented Jan 18, 2019 at 9:47
  • $\begingroup$ @OlliNiemitalo I didnt get your point. However, this plot is just a sample example. In other cases, the peaks could be spread along the full band. I tried npwgnthresh function in matlab but it didnt give me good threshold $\endgroup$
    – Ahmad
    Commented Jan 18, 2019 at 20:55

2 Answers 2

2
$\begingroup$

This is a pretty common problem in radar signal processing. Typically, we’ll use what’s called a CFAR detector (constant false alarm rate). This essentially boils down to a non-linear smoothing filter where to attempt to estimate the local average power of the signal (excluding the current cell under test (CUT)). Afterwards, a “bias factor” is applied; this is typically determined a priori. Anything above the CFAR level + bias factor is labeled as a detection, and everything else is ignored. I’m sure there is a wealth of publicly available information on the topic, and I’d highly recommend doing some googling, or even looking around more on this website.

EDIT: Neyman-Pearson is indeed the standard technique. There are loads of papers about this topic on IEEE Xplore, I highly recommend you check them out. That "bias factor" I talked about earlier is the thing you'll want to calculate based on your PFA or PD curve, which is a function of SNR.

$\endgroup$
1
  • $\begingroup$ I've found several formulas from different references about the Neyman Pearson threshold, but the did'nt give me proper values. These formulas are function of Probability of false alarm and Noise variance $\endgroup$
    – Ahmad
    Commented Jan 22, 2019 at 12:15
1
$\begingroup$

Look for peaks N dB above the localized noise floor.

Calculate the noise floor by taking the mean of all your samples (or choose an observation window size). You can throw out the top 1-3 samples (or however many you want) to reduce the bias on the mean. After that you can covert your mean to log and then look for peaks N dB above the mean.

$\endgroup$

Your Answer

By clicking “Post Your Answer”, you agree to our terms of service and acknowledge you have read our privacy policy.

Not the answer you're looking for? Browse other questions tagged or ask your own question.