3
$\begingroup$

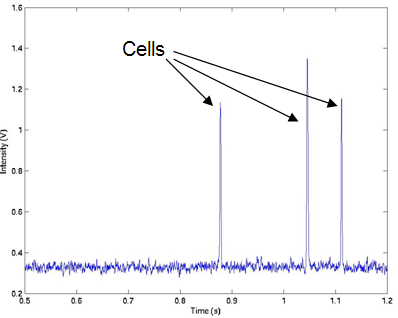
The following image is an example of a fluorescence signal trace from the photomultiplier tube detector (PMT). Each spike represents one fluorescently labeled cell.

enter image description here

This signal model is definitely not additive white Gaussian, although the noise term is Gaussian. The signals are low variance but the point is that when the signal amplitude increases, the noise variance rapidly decreases. In the given example, above the intensity value of $0.6$ all three Gaussian signals are almost noise free. Around $0.4-0.5$ intensity of the noise is reduced but can be seen if zoomed. Below $0.4$ the noise is significantly apparent.

How can this signal-noise relation be properly modeled? For example for additive noise we have $$x[n]=s[n]+w[n]$$ where $x$ is the received signal $s$ is the error free signal and $w$ is the Gaussian noise.

My aim is to simulate such signals in Matlab using a theoretical model. However, I was not able to see and/or find any model via google search or on some related books.

The physics behind this is due to detection of laser signal via photodiodes or PMTs. I was thinking that the noise source was probably the quantum noise but I am not sure because for the quantum noise, the noise variance does not decrease when the total number of photons $N$ increases. Instead it increases as $\sqrt N$.

What I tried was dividing the noise values by $k+s[n]^2$ before adding to the signal, where $k$ is some constant. I did this over additive Gaussian noise model. The results were okay. But I am not able to justify this theoretically. It is just my intuitive understanding.

Sources:

https://www.cut.ac.cy/faculties/fet/mem/research/research-units-and-laboratories/biolisys/research/imaging/cytometry/?languageId=1

https://en.wikipedia.org/wiki/Laser-induced_fluorescence

$\endgroup$
3
  • $\begingroup$ PMTs have several sources of noise, as do the amplifiers that process their signals. "almost noise-free" and "noise is significantly apparent" may not be the best way to judge. You have so few bins in one event that the rise and fall dominate the image. Your amplifier probably has a shaping circuit with a transfer function already optimized for the PMT's signal in terms of peak-height or total area, depending on how your ADC is gated and using the signal. Because PMTs have been the go-to device for so much science over the last half-century, there are tons of books and tutorials out there. $\endgroup$
    – uhoh
    Commented Oct 10, 2018 at 16:17
  • 1
    $\begingroup$ Are you able to repeat the fluorescence measurement in a controlled experiment so that you can then (with enough samples) estimate the noise of the signal from the experimental results? This would be the S+N result, and with the laser signal off as shown in the flat areas of your plot the estimation of the noise is straightforward. There are additional computations worth doing to confirm stationarity for purposes of such an estimation. As uhoh correctly indicated, the Signal estimate will be the signal after the electronics interface. $\endgroup$ Commented Oct 12, 2018 at 11:35
  • 1
    $\begingroup$ Further, when you estimate SNR like this, it is important to consider the noise density for the noise (so W/Hz). An FFT of the result with noise alone can be helpful to indicate how the noise is shaped versus frequency. $\endgroup$ Commented Oct 12, 2018 at 11:38

1 Answer 1

1
$\begingroup$

Second try! This question is also at the Electrical Engineering stack, so I posted a short 'starter' answer there. A mod converted it to a comment and my tiny rep there prevented me making any further comments. This is what I posted there:

I suggest this link to cbeleites's answer to a question involving laser-excited Raman spectroscopy: https://stats.stackexchange.com/a/194247/247352 and this golden oldie paper: N.J. Dovichi, J.C. Martin, J.H. Jett, M. Trkula, R.A. Keller, "Laser-Induced Fluorescence of Flowing Samples as an Approach to Single-Molecule Detection in Liquids", Anal. Chem.,56 (1984) 348-354. There are thousands of laser-induced (aka, laser excited) fluorescence papers, but newer research papers tend not to dwell on the fundamentals.

My research career, prior to retirement, involved the use and study of laser-based spectrometries, including laser-induced fluorescence (LIF) of molecular and atomic species. So the reason for the above paragraph was that I simply cannot understand how the noise can decrease with increased number of photons. Likewise, the correlation of the signal and noise is puzzling. Hence the references above.

I have been trying to simulate what I think is happening and get this:
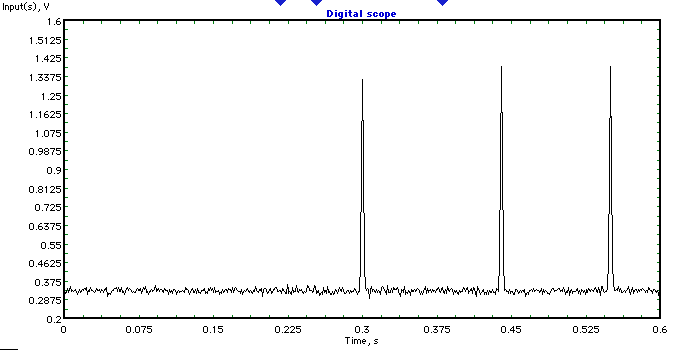
Simulated LIF responses

Maybe I am on the wrong track, but my model used 1) shot noise on the fluorescence peaks, 2) additive, white gaussian noise on the baseline and 3) some laser intensity fluctuations. It would help to know exactly how the PMT (or photodetector) output current leads to the observed fluorescence signals. Also, are there any unusual time constants that could result in unsuspected pulse stretching? The peaks in the OP's figure presumably have widths determined by the times it takes labelled cells to transit the region where the laser is focussed. This would be on the order of ms, so perhaps provides a clue about the correlation issue.

EDIT in response to OP queries. Without knowing any details, I assumed a fairly typical system: 1) CW laser excitation, 2) fluorophore-labeled cells, 3) a flow cytometer of some sort, 4) microscope objective, 5) PMT or other high gain photodetector, 6) preamplifier, 7) data acquisition, and so forth. As noted above, I assumed shot noise on the fluorescence emissions, white Gaussian noise (from the preamplifier) on the baseline, and about 0.5% Gaussian intensity fluctuations on the excitation laser. I ignored the variation in cell fluorophore loadings, because this has somewhat similar effect as laser intensity fluctuations. The simulation model (program, actually) is shown below:
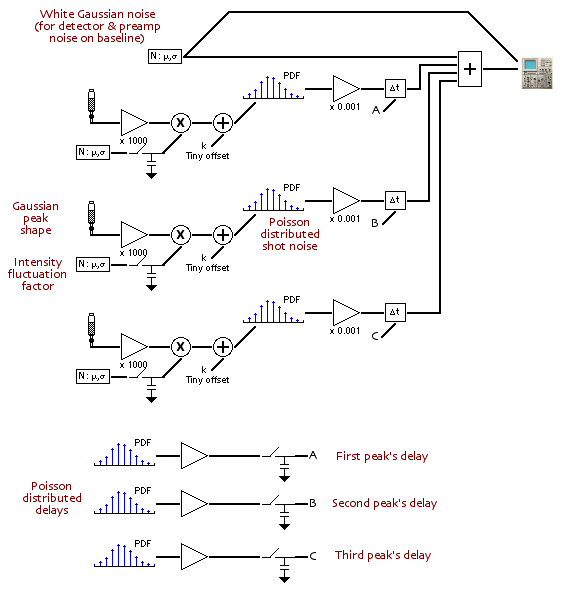
LIF simulation model

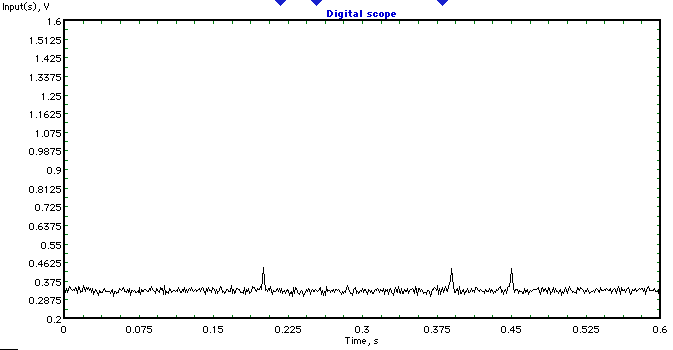
Every simulation run (start = 0, end = 0.6, $\Delta t = 0.001$) results in a new temporal response plot. The numbers I used were just arrived at by trial and error, trying to get close to the OP's plot. Lowering the gains on the three peaks, via the triangular gain blocks that have 'x 1000' under them, results in lower SNRs. The next two plots show the results for gain = 300 and gain = 100.
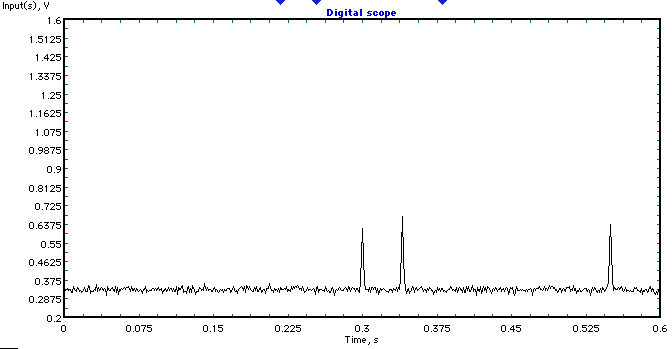
Lower SNR Sim LIF responses

Even lower SNR Sim LIF responses

I do not know if this is going to be of any help to the OP. Maybe it is over-simplified or I am missing something essential, but I did not have much to go on. I published my first laser induced (excited) molecular fluorescence paper in 1981 and my last in 2014, but I never encountered a molecular LIF system where the noise decreased with increasing number of emitted fluorescence photons. The correlation is also puzzling to me since I cannot think of how it might arise. Obviously, I am very curious to know what is going on!

$\endgroup$
1
  • $\begingroup$ can you provide more details about how you obtained this graph as well as some examples for low(er) SNRs? $\endgroup$ Commented Jun 10, 2019 at 20:49

Your Answer

By clicking “Post Your Answer”, you agree to our terms of service and acknowledge you have read our privacy policy.

Not the answer you're looking for? Browse other questions tagged or ask your own question.