Added material in response to OP queries.
Source Link
Ed V
  • 825
  • 1
  • 6
  • 11

Second try! This question is also at the Electrical Engineering stack, so I posted a short 'starter' answer there. A mod converted it to a comment and my tiny rep there prevented me making any further comments. This is what I posted there:

I suggest this link to cbeleites's answer to a question involving laser-excited Raman spectroscopy: https://stats.stackexchange.com/a/194247/247352 and this golden oldie paper: N.J. Dovichi, J.C. Martin, J.H. Jett, M. Trkula, R.A. Keller, "Laser-Induced Fluorescence of Flowing Samples as an Approach to Single-Molecule Detection in Liquids", Anal. Chem.,56 (1984) 348-354. There are thousands of laser-induced (aka, laser excited) fluorescence papers, but newer research papers tend not to dwell on the fundamentals.

My research career, prior to retirement, involved the use and study of laser-based spectrometries, including laser-induced fluorescence (LIF) of molecular and atomic species. So the reason for the above paragraph was that I simply cannot understand how the noise can decrease with increased number of photons. Likewise, the correlation of the signal and noise is puzzling. Hence the references above.

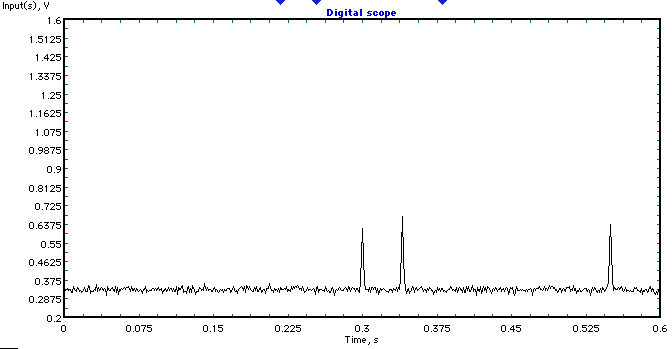
I have been trying to simulate what I think is happening and get this:

Simulated LIF responses

Maybe I am on the wrong track, but my model used 1) shot noise on the fluorescence peaks, 2) additive, white gaussian noise on the baseline and 3) some laser intensity fluctuations. It would help to know exactly how the PMT (or photodetector) output current leads to the observed fluorescence signals. Also, are there any unusual time constants that could result in unsuspected pulse stretching? The peaks in the OP's figure presumably have widths determined by the times it takes labelled cells to transit the region where the laser is focussed. This would be on the order of ms, so perhaps provides a clue about the correlation issue.

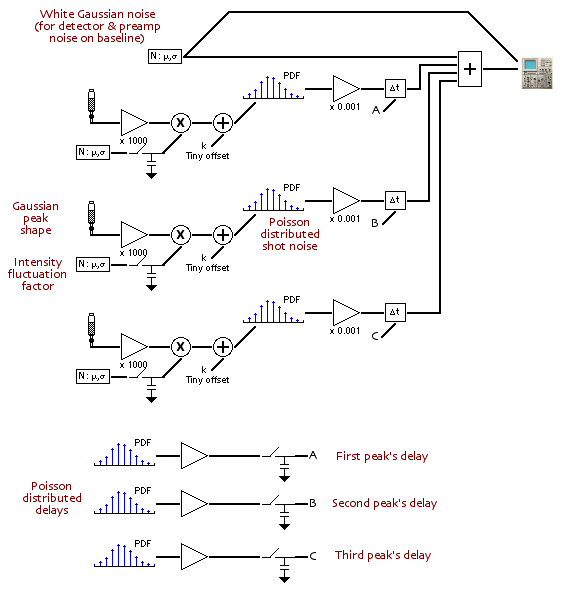
EDIT in response to OP queries. Without knowing any details, I assumed a fairly typical system: 1) CW laser excitation, 2) fluorophore-labeled cells, 3) a flow cytometer of some sort, 4) microscope objective, 5) PMT or other high gain photodetector, 6) preamplifier, 7) data acquisition, and so forth. As noted above, I assumed shot noise on the fluorescence emissions, white Gaussian noise (from the preamplifier) on the baseline, and about 0.5% Gaussian intensity fluctuations on the excitation laser. I ignored the variation in cell fluorophore loadings, because this has somewhat similar effect as laser intensity fluctuations. The simulation model (program, actually) is shown below:

LIF simulation model

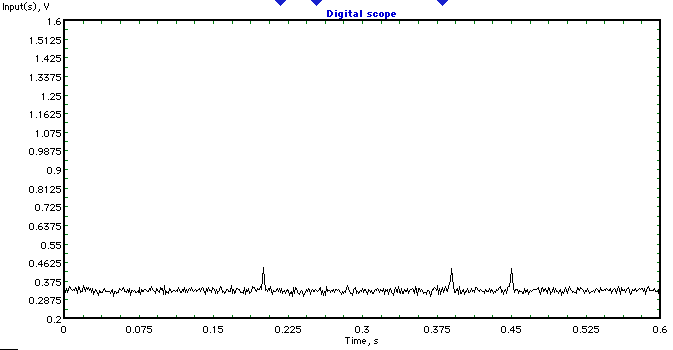
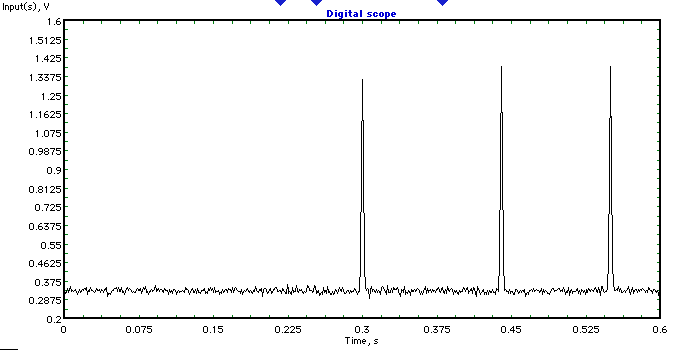
Every simulation run (start = 0, end = 0.6, $\Delta t = 0.001$) results in a new temporal response plot. The numbers I used were just arrived at by trial and error, trying to get close to the OP's plot. Lowering the gains on the three peaks, via the triangular gain blocks that have 'x 1000' under them, results in lower SNRs. The next two plots show the results for gain = 300 and gain = 100.

Lower SNR Sim LIF responses

Even lower SNR Sim LIF responses

I do not know if this is going to be of any help to the OP. Maybe it is over-simplified or I am missing something essential, but I did not have much to go on. I published my first laser induced (excited) molecular fluorescence paper in 1981 and my last in 2014, but I never encountered a molecular LIF system where the noise decreased with increasing number of emitted fluorescence photons. The correlation is also puzzling to me since I cannot think of how it might arise. Obviously, I am very curious to know what is going on!

Second try! This question is also at the Electrical Engineering stack, so I posted a short 'starter' answer there. A mod converted it to a comment and my tiny rep there prevented me making any further comments. This is what I posted there:

I suggest this link to cbeleites's answer to a question involving laser-excited Raman spectroscopy: https://stats.stackexchange.com/a/194247/247352 and this golden oldie paper: N.J. Dovichi, J.C. Martin, J.H. Jett, M. Trkula, R.A. Keller, "Laser-Induced Fluorescence of Flowing Samples as an Approach to Single-Molecule Detection in Liquids", Anal. Chem.,56 (1984) 348-354. There are thousands of laser-induced (aka, laser excited) fluorescence papers, but newer research papers tend not to dwell on the fundamentals.

My research career, prior to retirement, involved the use and study of laser-based spectrometries, including laser-induced fluorescence (LIF) of molecular and atomic species. So the reason for the above paragraph was that I simply cannot understand how the noise can decrease with increased number of photons. Likewise, the correlation of the signal and noise is puzzling. Hence the references above.

I have been trying to simulate what I think is happening and get this:

Simulated LIF responses

Maybe I am on the wrong track, but my model used 1) shot noise on the fluorescence peaks, 2) additive, white gaussian noise on the baseline and 3) some laser intensity fluctuations. It would help to know exactly how the PMT (or photodetector) output current leads to the observed fluorescence signals. Also, are there any unusual time constants that could result in unsuspected pulse stretching? The peaks in the OP's figure presumably have widths determined by the times it takes labelled cells to transit the region where the laser is focussed. This would be on the order of ms, so perhaps provides a clue about the correlation issue.

EDIT in response to OP queries. Without knowing any details, I assumed a fairly typical system: 1) CW laser excitation, 2) fluorophore-labeled cells, 3) a flow cytometer of some sort, 4) microscope objective, 5) PMT or other high gain photodetector, 6) preamplifier, 7) data acquisition, and so forth. As noted above, I assumed shot noise on the fluorescence emissions, white Gaussian noise (from the preamplifier) on the baseline, and about 0.5% Gaussian intensity fluctuations on the excitation laser. I ignored the variation in cell fluorophore loadings, because this has somewhat similar effect as laser intensity fluctuations. The simulation model (program, actually) is shown below:

LIF simulation model

Every simulation run (start = 0, end = 0.6, $\Delta t = 0.001$) results in a new temporal response plot. The numbers I used were just arrived at by trial and error, trying to get close to the OP's plot. Lowering the gains on the three peaks, via the triangular gain blocks that have 'x 1000' under them, results in lower SNRs. The next two plots show the results for gain = 300 and gain = 100.

Lower SNR Sim LIF responses

Even lower SNR Sim LIF responses

I do not know if this is going to be of any help to the OP. Maybe it is over-simplified or I am missing something essential, but I did not have much to go on. I published my first laser induced (excited) molecular fluorescence paper in 1981 and my last in 2014, but I never encountered a molecular LIF system where the noise decreased with increasing number of emitted fluorescence photons. The correlation is also puzzling to me since I cannot think of how it might arise. Obviously, I am very curious to know what is going on!
Source Link
Ed V
  • 825
  • 1
  • 6
  • 11

Second try! This question is also at the Electrical Engineering stack, so I posted a short 'starter' answer there. A mod converted it to a comment and my tiny rep there prevented me making any further comments. This is what I posted there:

I suggest this link to cbeleites's answer to a question involving laser-excited Raman spectroscopy: https://stats.stackexchange.com/a/194247/247352 and this golden oldie paper: N.J. Dovichi, J.C. Martin, J.H. Jett, M. Trkula, R.A. Keller, "Laser-Induced Fluorescence of Flowing Samples as an Approach to Single-Molecule Detection in Liquids", Anal. Chem.,56 (1984) 348-354. There are thousands of laser-induced (aka, laser excited) fluorescence papers, but newer research papers tend not to dwell on the fundamentals.

My research career, prior to retirement, involved the use and study of laser-based spectrometries, including laser-induced fluorescence (LIF) of molecular and atomic species. So the reason for the above paragraph was that I simply cannot understand how the noise can decrease with increased number of photons. Likewise, the correlation of the signal and noise is puzzling. Hence the references above.

I have been trying to simulate what I think is happening and get this:

Simulated LIF responses

Maybe I am on the wrong track, but my model used 1) shot noise on the fluorescence peaks, 2) additive, white gaussian noise on the baseline and 3) some laser intensity fluctuations. It would help to know exactly how the PMT (or photodetector) output current leads to the observed fluorescence signals. Also, are there any unusual time constants that could result in unsuspected pulse stretching? The peaks in the OP's figure presumably have widths determined by the times it takes labelled cells to transit the region where the laser is focussed. This would be on the order of ms, so perhaps provides a clue about the correlation issue.