2
$\begingroup$

Consider an input signal x_total and the complex envelope of an output signal y_total in MATLAB:

T = 10e-9;                            
f_s = 1e12;                                             
t = [0 : 1/f_s : T]';                                       
f_c = 11.5e9;                      

f_1 = -0.1e9;                                                            
f_2 = 0;                                                                 
f   = [f_1 f_2]';

x_1 = 1*sin(2*pi*(f_c + f(1))*t);                                        
x_2 = 1*sin(2*pi*(f_c + f(2))*t);                                       
x_total = x_1 + x_2;

y_envelope = A_out .* exp(1i* theta) .* exp(1i*Phi);

2 Questions:

How do I plot the spectrum of x_total? X_total = fft(x_total) yields a complex result. I want the x-axis of my spectrum to be in Hertz.

And I want to plot the spectrum of my output signal y_total as well. From the complex envelope, can I say y_total = A_out*sin(2*pi*f_c*t + (theta+Phi))?

I just read: A = abs(X_total) * 2/(f_s*T) should yield the amplitude
and f = linspace(0,f_s,length(X_total)) should yield the corresponding frequency.
Why do I have to normalize the amplitude by 2/(f_s*T) ? Applying this code yields the spectrum for x_total, which I want.
Applying the same for y_total does not yield a spectrum at all, when I plot it. Why not?

$\endgroup$
1
  • $\begingroup$ dividing by f_s*T is the same as dividing by length(x_input). The DFT (or FFT) is an integration, which means the longer your acquisition, the higher the amplitude. You normalize to get the same amplitude regardless of the length of your acquisition. $\endgroup$
    – user20917
    Commented Dec 18, 2016 at 14:51

3 Answers 3

1
$\begingroup$

In order to plot the amplitude of a spectrum in matlab, here's what you can do. Where

  • y is the signal
  • fs is the samplig frquency

Code:

spectrum = 10*log(abs(fftshift(fft(y))) / length(y));   %compute the FFT
precision = fs/length(y);
f = linspace(-fs/2+precision/2, fs/2-precision/2, length(y)); % Create the frequency axis and put the measure in the middle of the bin.
plot(f,spectrum);

And voilà.

A little more explanation :

  • fft(y) : yields the complex spectrum (amplitude and phase in complex numbers). The fft function puts the negative part of the spectrum on the right.
  • fftshift(fft(y)) : brings the negative part of the spectrum at the beggining of your data so it can be displayed on the left of your spectrum.
  • abs( fftshift(fft(y)) ) : extract the amplitude of your values, thus remove the phase and yields real numbers.
  • abs( fftshift(fft(y)) ) /length(y) : Normalize your spectrum. Since the DFT or FFT is an integral, the bigger the dataset, the bigger the amplitude. By dividing by the number of sample, we get an amplitude that is not dependant on the acquisition length. Doing length(y) is the same as fs*T (where T the length of the acquisition in time).
  • 10*log( abs( fftshift(fft(y)) ) /length(y) ) : Will scale the spectrum on a logarithmic scale. We often do that to be able to see a bigger range of values. If your noise floor is at -80dB and your signal at 0dB. That means an amplitude of 1 and a noise level of 0.00000001. You can't really see both on a linear plot.

In your question, you asked :

Why do we normalize with 2/(f_s*T)

I explained the division. As for multiplying by 2, I am not sure where you took this information but my guess would be that you looked at an example that was meant to display a single-sided spectrum. A double sided spectrum goes up tu A/2. If you are measuring a real signal (no complex values at the input), the spectrum is symmetrical, therefore looking at the positive side of it makes more sense.

Finally, you said :

I just read: A = abs(X_total) * 2/(f_s*T) should yield the amplitude and f = linspace(0,f_s,length(X_total)) should yield the corresponding frequency.

Amplitude part is correct. f = linspace(0,f_s,length(X_total)) is wrong Your spectrum will go up to fs/2 (Nyquist frequency).

And as for y_envelope, your script doesn't show what the values are of theta and Phi. Are they scalars or vectors ?

$\endgroup$
6
  • $\begingroup$ When I want to calculate the one-sided fft, are you saying I can run this code: 10*log( abs( fftshift(fft(y)) ) *2 /length(y) ) ? Would I have to change f as well? $\endgroup$
    – user25356
    Commented Dec 21, 2016 at 18:06
  • $\begingroup$ does f = linspace(-f_s/2,f_s/2,length(x_total)) yield the frequency in Hz? Isn't length(x_total) equal to the number of samples? When you apply the log, do you mean log10 ? This would yield an output in dB, wouldn't it? $\endgroup$
    – user25356
    Commented Dec 21, 2016 at 20:41
  • $\begingroup$ One-Sided fft : To my knowledge, yes. It is true for real numbers. When you do the FFT of complex numbers, the spectrum is not symmetrical, therefore you can't do that assumption. $\endgroup$
    – user20917
    Commented Dec 21, 2016 at 20:44
  • $\begingroup$ Yes linspace(-f_s/2,f_s/2,length(x_total)) yields the frequency in Hz. And length(x_total) is the number of sample. Therefore, the precision of your spectrum is directly proportional to the number of sample you have. Longer acquisiton means more precise spectrum. $\endgroup$
    – user20917
    Commented Dec 21, 2016 at 20:46
  • $\begingroup$ Yes, when I say log, is meant log10(), but that doesn't exactly means dB. Decibel is the ratio between 2 values. Some units like the dBV are relative to a unit of 1, but not all. For instance, if your signal is a measure of voltage and you want dBV, you would need to do log10(y/1) which is the same as log10(y). If you measure power and you want dBm, you will do log10(y/0.001) because dBm are relative to a milliwatt. $\endgroup$
    – user20917
    Commented Dec 21, 2016 at 20:50
1
$\begingroup$

One way is simply to plot the absolute value:

X_total = fft(x_total);
figure;
plot(10*log10(abs(X_total).^2));

Note that if your signal is real, you can plot only the first part of the vector.
Another option is to use the Welch Periodogram

figure;
pwelch(x_total);
$\endgroup$
1
  • $\begingroup$ Why the log10 and the .^2 ? $\endgroup$
    – user25356
    Commented Dec 18, 2016 at 7:25
0
$\begingroup$

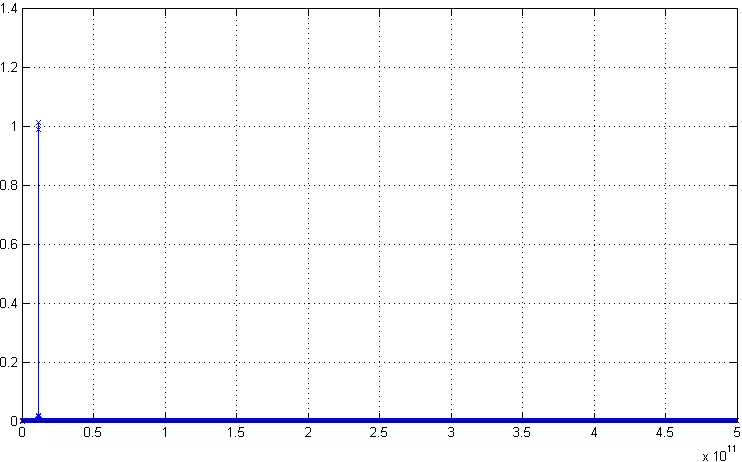
Amplitude corrections to the Discrete Fourier transform or the FFT aim at better interpreting the result. For instance, a cosine with amplitude one could be expected to have a peak with amplitude one in the frequency domain. The bit of code 'FFTR.m' should do the job for a real signal and a single-sided spectrum. You can use it without output to get an image with a dB scale:

FFTR(x_total)

or with a linear scale:

[fftR,fftAxe] = FFTR(x_total,1/f_s);plot(fftAxe,fftR,'x');grid on

enter image description here

$\endgroup$

Your Answer

By clicking “Post Your Answer”, you agree to our terms of service and acknowledge you have read our privacy policy.