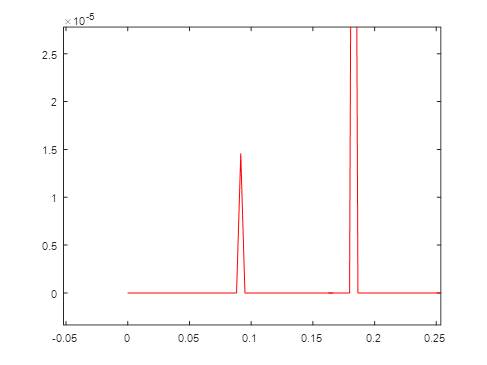
After concatenating an 11-second *.WAV (sample rate 44100 Hz) file 27 times (just by gluing them head-to-tail), I obtained a ~300-sec noise signal. I used MATLAB(2015b) and the FFT function on both the original file and the concatenated signal. The FFT of the concatenated signal was, as expected, pretty similar to the original. However, for every y-axis point (spectral power) in the concatenated FFT, there were 2 zeros (not precisely zero, but values in the order of x*10-19, so about 18 orders of magnitude below the 'real' FFT values). The original noise file was specifically designed to allow for looping. Below a close up of the concatenated FFT showing the added zeros:
Hence, the spectral power plot of the concatenated signal looked like the original, but every frequency power point was preceded and followed by two zeros. How can this be? Does it have to do with the fact that lengthening a signal increases the resolution of the FFT and that frequencies are analyzed in the concatenated signal that are not present in the original signal due to resolution restrictions? Or is this rather an error in my script? Other spectra showed up fine, though.

