2
$\begingroup$

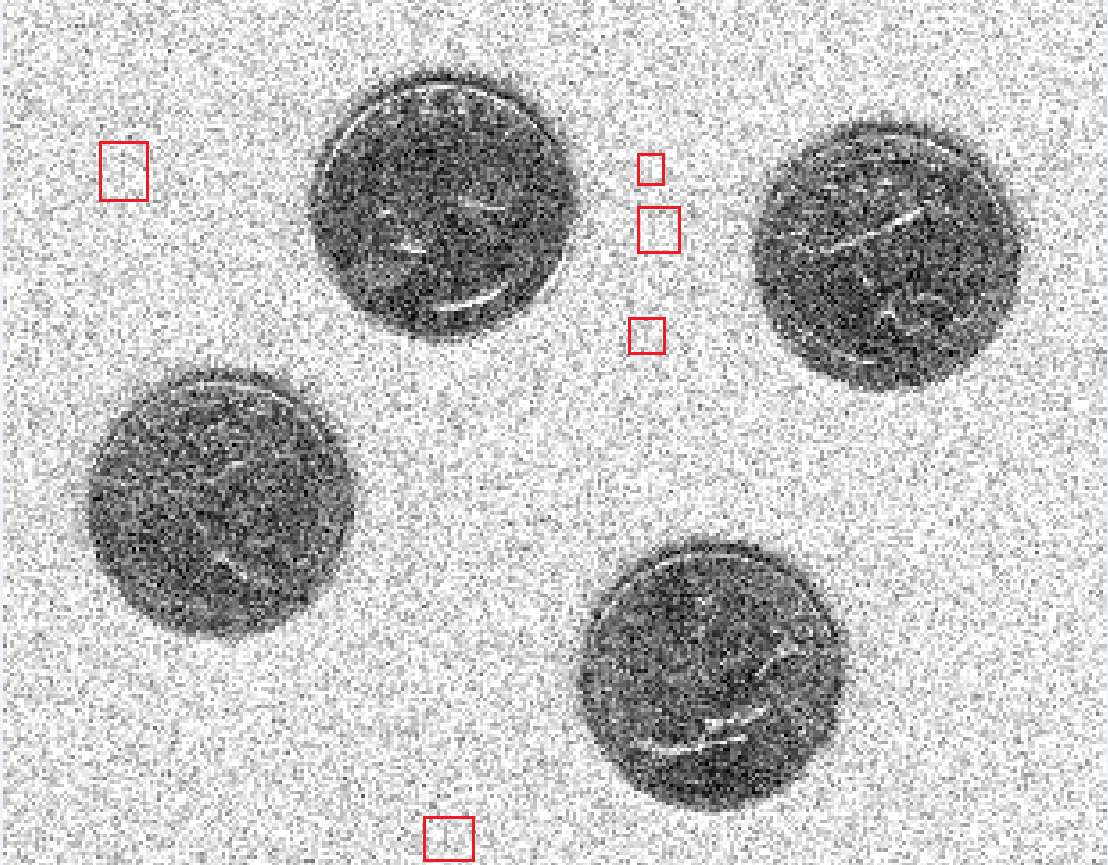
I am using Matlab function imnoise to add gaussian noise to one image. However, it seems that adjacent samples of the noise is correlated. I am using matlab code below to add noise.

 I = imread('eight.tif');
 J = imnoise(I, 'gaussian', 0, 0.02);
 figure; imshow(I);
 figure; imshow(J);

enter image description here

From the image, it contains many short vertical gray lines which maybe be image structures for some cases. Is the noise really additive white gaussian noise(AWGN)?

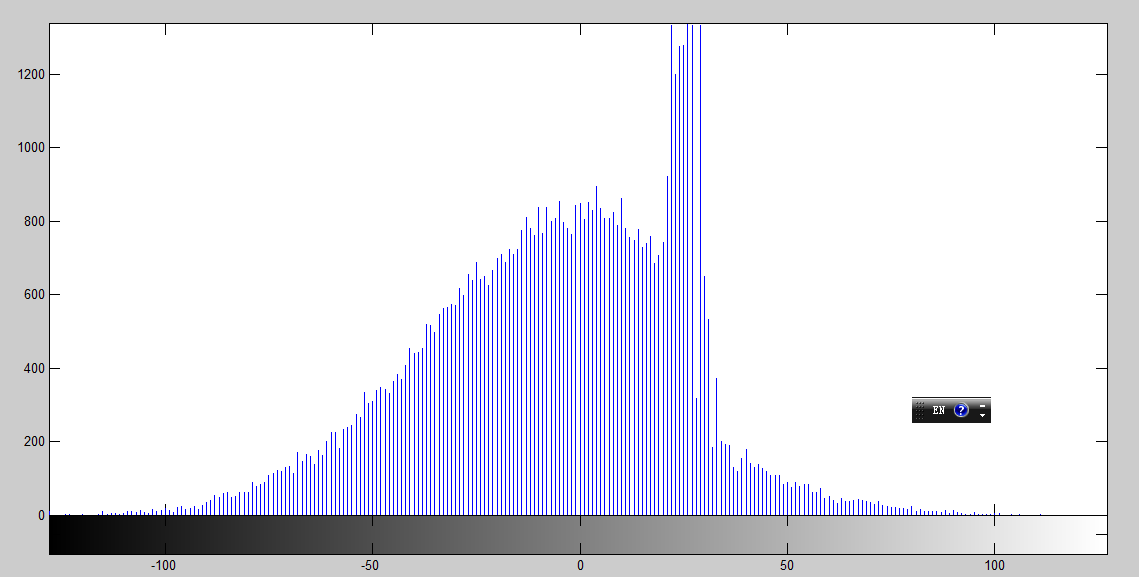
histogram of noise: enter image description here

$\endgroup$
7
  • 1
    $\begingroup$ Perhaps those patterns appear just as often as you would expect from white noise. What does the autocorrelation (using xcorr2 maybe) of the noise look like? For white noise it should be just a single spike with a noise floor. $\endgroup$ Commented Feb 14, 2016 at 11:05
  • 1
    $\begingroup$ I feel the each intensity of the pixels in lines is different. $\endgroup$
    – KKS
    Commented Feb 14, 2016 at 11:30
  • $\begingroup$ @OlliNiemitalo Just as you mentioned, the output of xcorr2 is a single spike. cc = xcorr2(double(J - I), double(J - I)). I only know correlation between random variables. From the link en.wikipedia.org/wiki/Autocorrelation, one image is considered as a random process. Is it same as a 2d matrix of random variables? $\endgroup$ Commented Feb 15, 2016 at 3:06
  • $\begingroup$ @김갑수The lines have lengths of several pixels, even if the variance of the noise is small. They are like image patterns. They will be left as lines in filtered images when I am trying to remove noise. $\endgroup$ Commented Feb 15, 2016 at 3:13
  • 1
    $\begingroup$ I don't know the exact formula for the error but for white noise I think the error's standard deviation decays by $1/\sqrt{N}$, where $N$ is the number of observations used in calculation of one value of the autocorrelation matrix. $\endgroup$ Commented Feb 15, 2016 at 8:51

1 Answer 1

2
$\begingroup$

Yes it is. However, unlike real AWGN which comes mostly from thermal agitation in electronics, matlab's noise is not purely random, this might be the cause of you seeing a deterministic pattern. But this pseudo-random noise is usually random enough to approximate real life noise

If you want to assess the noise "randomness", plot an intensity histogram of In-I, with In being the noised image and I the original image (you are subtracting the deterministic part and keeping the random part).

$\endgroup$
1
  • $\begingroup$ On the histogram, there are some peaks. I guess it may be caused by clipping. Is this common for noise in images? $\endgroup$ Commented Feb 15, 2016 at 4:57

Your Answer

By clicking “Post Your Answer”, you agree to our terms of service and acknowledge you have read our privacy policy.

Not the answer you're looking for? Browse other questions tagged or ask your own question.