2
$\begingroup$

I know that MFCC features are the spectral envelope of the input signal but I can't understand what do they mean and what do they represent . and if I have two people saying the same word how can I compare the resulting features.

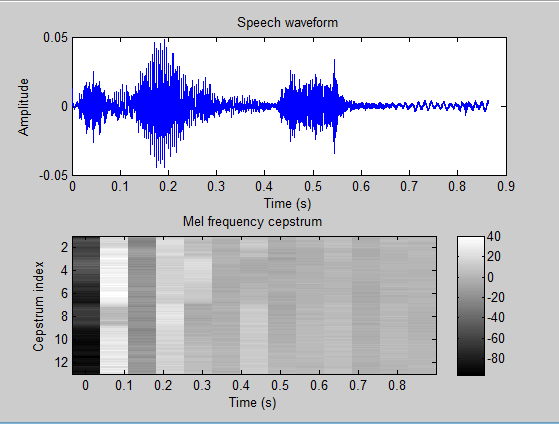
For example I have Mel Frequency Cepstral Coefficient for the word "please": first person:

enter image description here

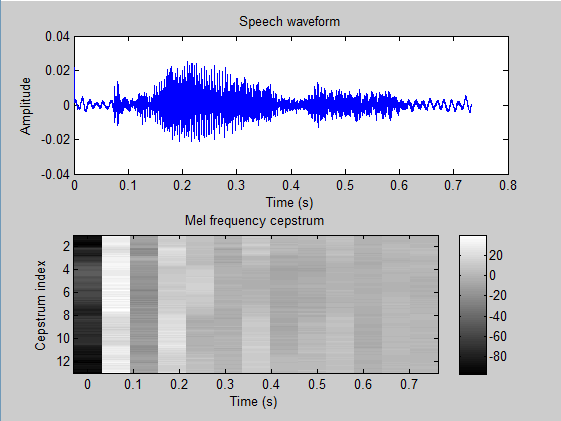
second person:

enter image description here

I see these signals seem different but thay are representing the same word which is 'please' .

I've done these steps to extract the features:

  • framing with overlapping percentage equals to 50%.
  • Windowing : hamming window was used
  • perform fft(signal);
  • take the squared magnitude of the ff(signal);
  • apply mel filter bank :number of filters = 26;
  • take the logarithm of squared sum for each filter
  • perform dct .
$\endgroup$
3
  • $\begingroup$ Well, definitely you must not compare them by an "eye inspection", unless you can imagine 12+ dimensions. Easiest way is to calculate the distance. Obviously due to the differences in variance, you can't use simple Euclidean distance. For that purpose you should use the Mahalanobis distance since it takes the difference of variance into account (first it should be calculated across the dataset). Another thing is the time warping. In that case use the DTW. $\endgroup$
    – jojeck
    Commented Dec 1, 2015 at 19:20
  • $\begingroup$ What do you exactly mean? It should be obvious with an example if you know about what MFCC-calculation does that the same words spoken by different persons (or even by the same person repeatedly) will differ for example in their pitch (or pronounciation) and therefore frequency components per time. Just think about saying "please" in a friendly and in an angry way. In the example you posted the MFCCs seem to similar to make intuitive assumptions about why they differ. $\endgroup$
    – Jamona
    Commented Dec 1, 2015 at 23:03
  • $\begingroup$ @Jamona: Please do not write multiple non-answers as answers. I have deleted those and made them comments. $\endgroup$
    – Peter K.
    Commented Dec 1, 2015 at 23:05

2 Answers 2

1
$\begingroup$

Like already said, an eye inspection in this case is not possible since the data is just to high-dimensional. Thus what you want to do is to inspect the difference magnitudes of the frequencies per time frame.

I would suggest that you have a look at the cosine distance in this case. It's not the only way but a good possibility to compare MFCCs without distortion due to the different overall loudness of the word. The cosine distance is 1 - cosine similarity and is frequently used in text mining. In this area it might be important to be independent of the document length (document A with 100 words, 10 * "Hello" and 90 * "Bye" should be similar to document B with 200 words, 20 * "Hello" and 180 "Bye"). Another way of explaining this distance is perform a normalization step (project each data point on the unit sphere) and then measure the euclidian distance.

The cosine distance looks at the angle between two vectors (in your case you have one vector per time/frequency-bin) and therefore gets rid of the overall magnitude. This would by one way of comparing your MFCCs.

$\endgroup$
1
$\begingroup$
  • To compare speech samples in that way, you need to perfectly align the samples. What if the second person will spend 50 ms more to pronounce the word? You would not be able to treat the MFCC arrays as being in one vector space.
  • I think to reach the goal of identifying by a spoken 'code phrase' it would be better to use techniques that do pitch detection, LPC etc. For very small vocabulary and limited number of people to be identified simple power density comparison could be OK. At least you would have one feature space.
$\endgroup$

Your Answer

By clicking “Post Your Answer”, you agree to our terms of service and acknowledge you have read our privacy policy.

Not the answer you're looking for? Browse other questions tagged or ask your own question.