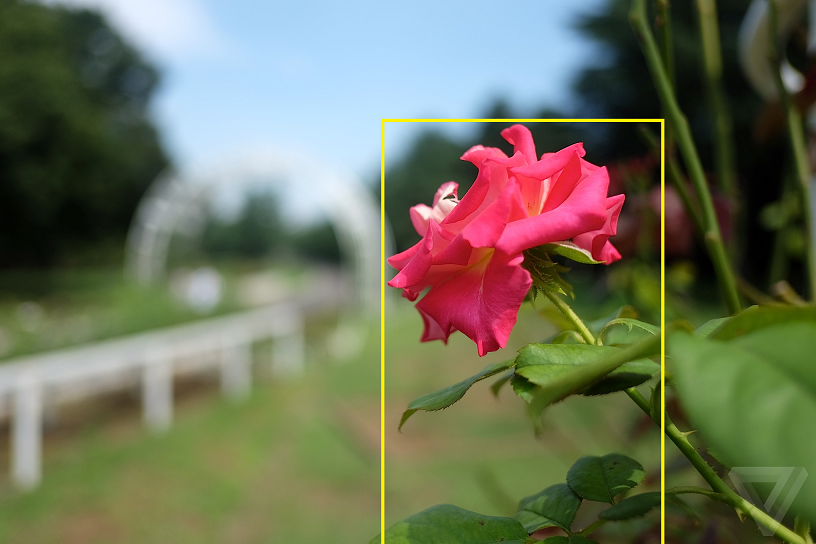
I have an image taken by a mobile phone camera with focus on a part of it let say a face or whatever.
I want to know -approximately- where is the focused area. For example, a bounding box around the focused area.
example :


2 Answers
In general, this is an image segmentation problem (http://en.wikipedia.org/wiki/Image_segmentation) into which you would be trying to isolate the focused to the non-focused regions of the image.
Optical lenses are equivalent to low pass filters anyway and the effect of a low pass filter on a signal is to smooth it out by limiting the higher frequency content.
In digital image processing, low frequencies correspond to big objects (general form) and higher frequencies correspond to small objects (details).
Therefore, to isolate the focused region, you could be looking for areas that are at a higher standard deviation relative to the blurred areas which would be at a lower standard deviation because of the smoothing operation of the out-of-focus lens.
To distinguish 'blurred' vs 'non-blurred' regions you can setup a "window" of dimensions $M \times N$ and slide it over your image.
At each position of the window compute the variance of the "patch" values as if they were a one-dimensional vector of $M \times N$ values. This will result in another "image" (or more generally a two-dimensional array) depicting the variation of the standard deviation at each location on your image. You can then collect all of these values and obtain their histogram. The histogram will exhibit a multimodal distribution (For more information please see http://en.wikipedia.org/wiki/Multimodal_distribution ).
In the case of the image in your post, the histogram is likely to exhibit two modes. One corresponding to relatively high values of standard deviation (focused area) and one corresponding to relatively low values of standard deviation (blurred areas).
You can then position a threshold, for example just between the two modes to establish a criterion between your focused and unfocused regions and then select all "patches" (or MxN window areas) whose standard deviation is higher than your threshold. (For more information please see: http://en.wikipedia.org/wiki/Thresholding_%28image_processing%29)
This will isolate the focused parts of the image for you.
Hope this helps.
-
$\begingroup$ I am going to make a deep reading for your answer and come back with a feed back, Many thanks $\endgroup$ Commented Mar 26, 2015 at 16:10
-
$\begingroup$ Thank you very much, great and detailed answer, I am going to share the implementation if I got good results using opencv, thanks again $\endgroup$ Commented Mar 27, 2015 at 6:44
-
$\begingroup$ By the way do thing a gray representative of the image is sufficient or I need o process each channel ? $\endgroup$ Commented Mar 27, 2015 at 6:50
-
$\begingroup$ Glad you found it helpful. Working in grayscale would work just fine for the discrimination between blurred and focused areas but including additional colour information could help you to prescribe more complex areas (for example, track the area of a face in a portrait or isolate just the flower in the picture in your post). $\endgroup$– A_ACommented Mar 27, 2015 at 8:38
-
$\begingroup$ The question was edited back to its original form following the discussion at: meta.dsp.stackexchange.com/questions/1337/… @vast-academician Please add your comments as a separate response. The main part has been preserved at: pastebin.com/kjCC1wM6 $\endgroup$– A_ACommented Mar 7, 2016 at 11:00
Here is an easier approach, that does not involve sliding-window analysis.
Convert your image to grayscale (this is not required, but I will assume that you only have one channel for the sake of clarity)
Calculate the gradient in both directions
Calculate the magnitude (or just square the gradient)
Sum both gradient images in both directions
As was already said, the focussed part of the image will have higher frequencies than the non-focussed area. From the summation you will end up with two projections, where there is a lot of variation (higher values) in that part where the focussed object is placed along this direction. You can do now the following:
Determine the start and end point of these higher values. You could use a simple threshold (e.g. 0.7*maximum_value) or smooth the profiles, take the second derivative and check for the highest values in there.
The Start/Stop positions from the previous step give you the pixel positions along both directions where to place your area-of-sharpnes-indicating rectangle.
