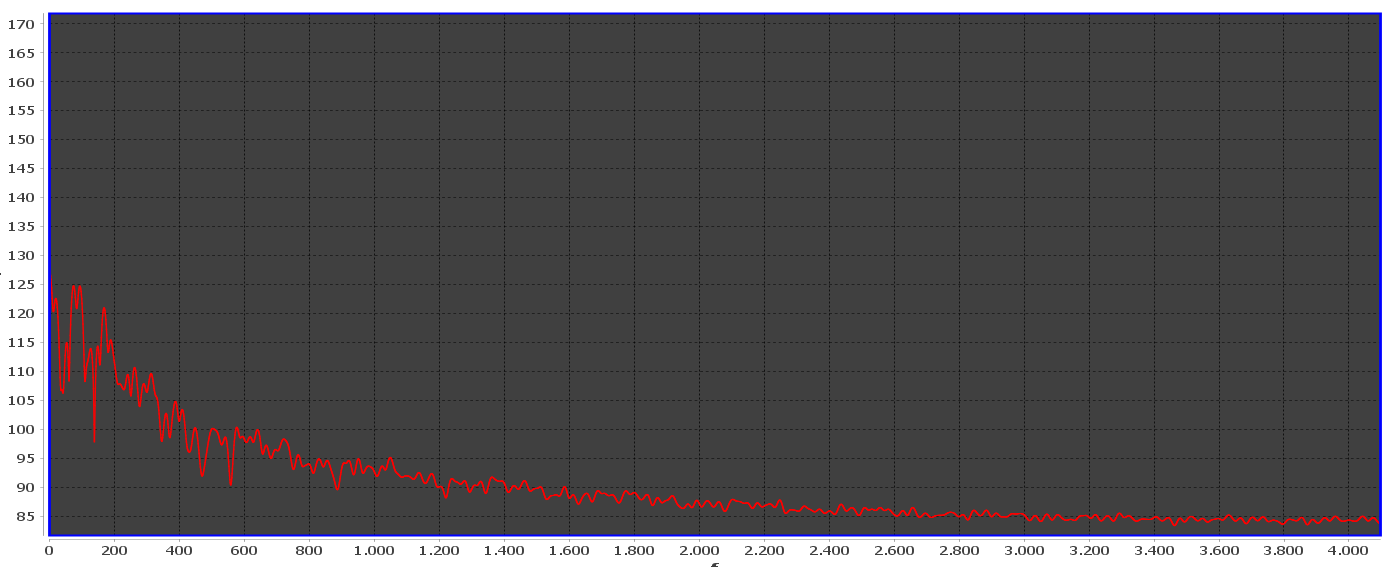
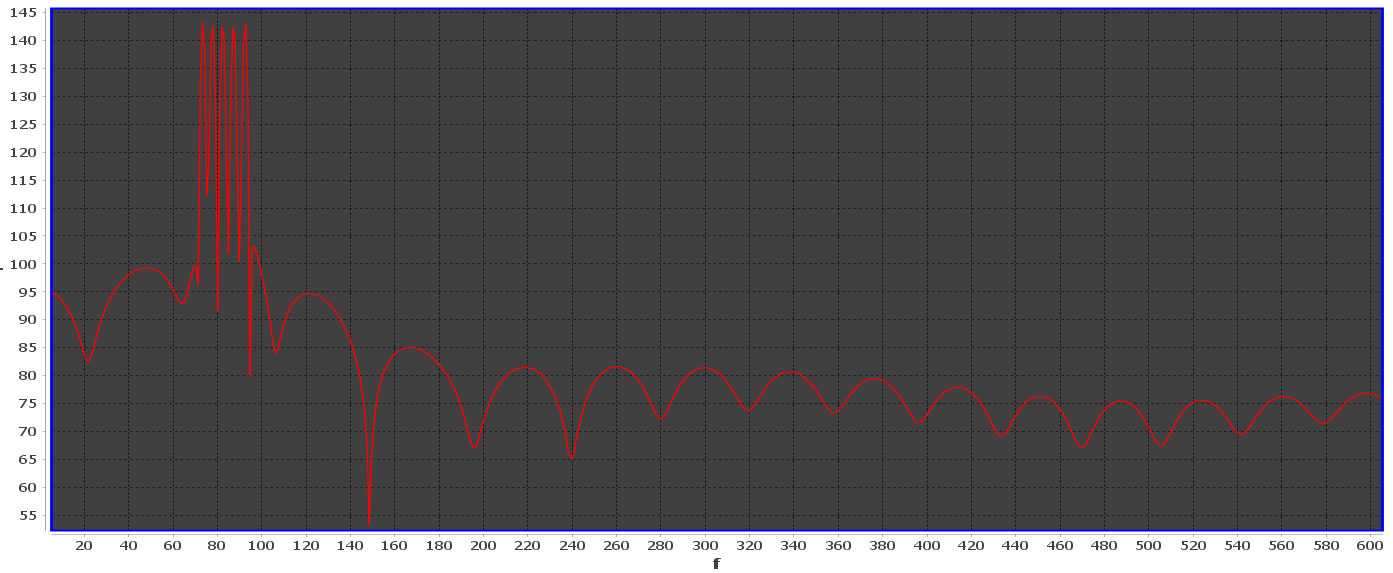
I'm trying to plot my FFT of File. This i my result. I made my FFT application:
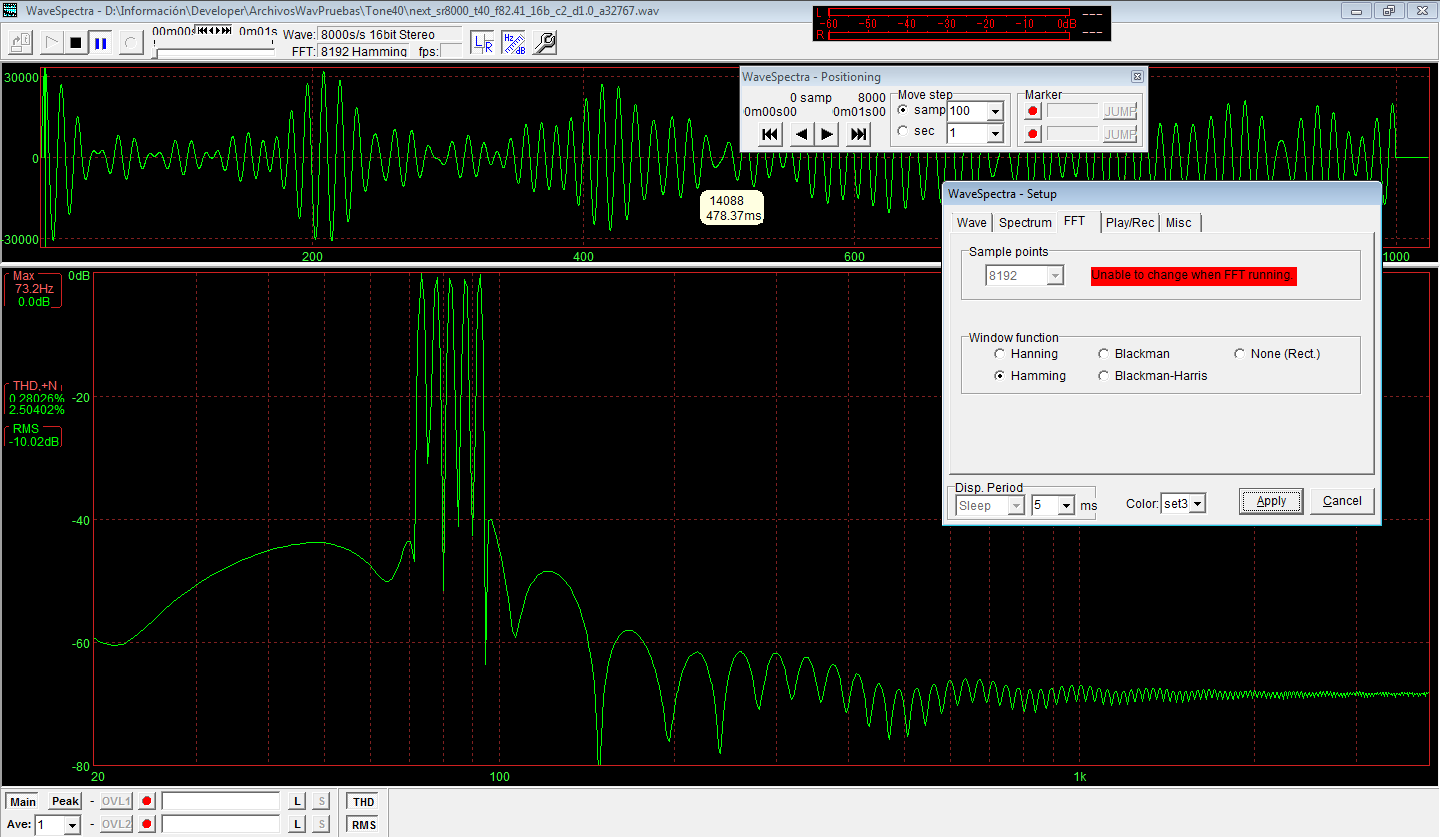
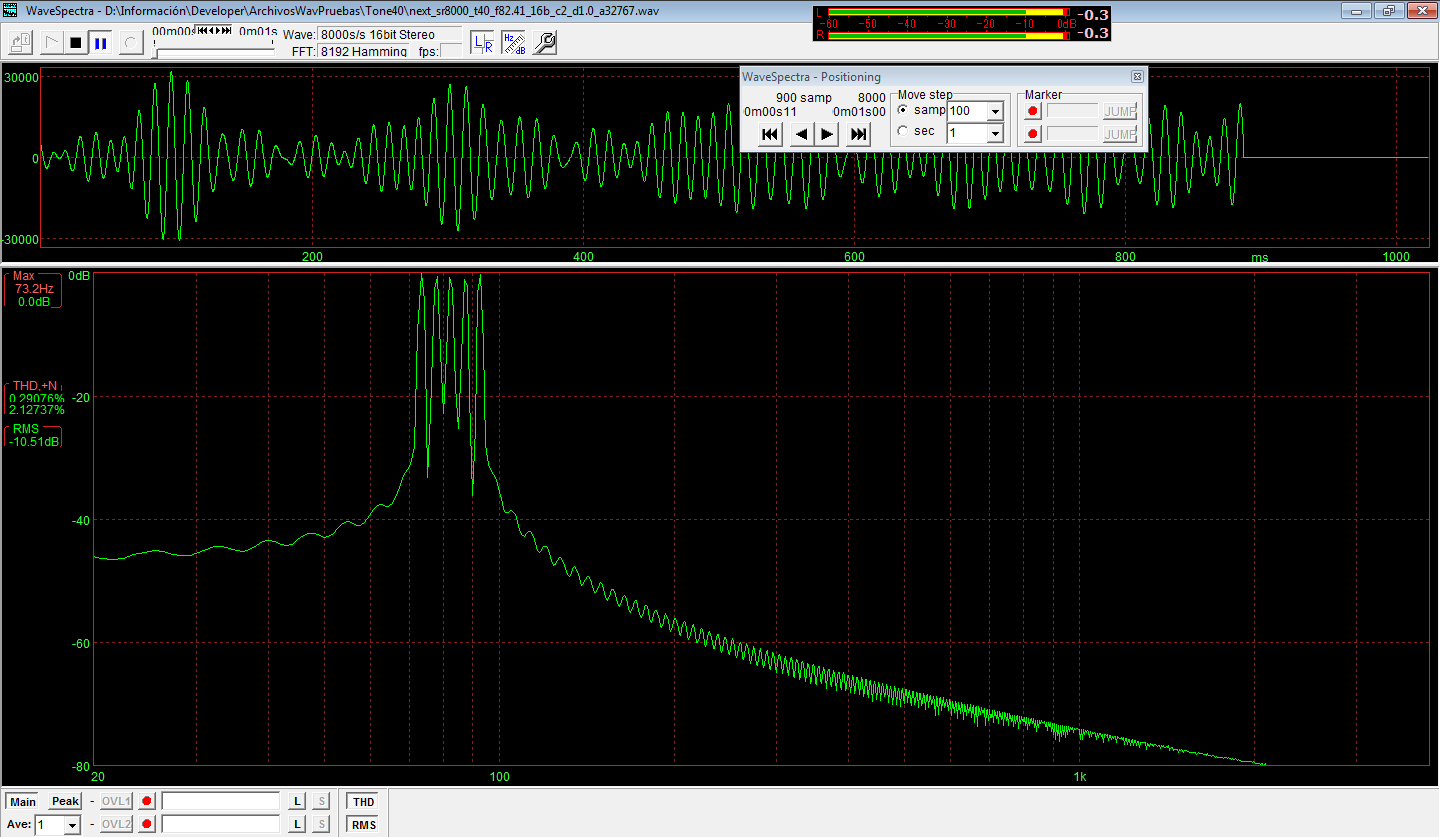
I want to obtain something very similar to plot of WaveSpectra, please tell me my mistakes..
My FFT

The result from WaveSpectra
 Other result from WaveSpectra

Here my code:
double[] Samples = null;
try {

  RandomAccessFile rafr = new RandomAccessFile(TheFile, "r");  //TheFile String with path and WAV filename
  //double[] getSamplesFile(rafr,"left",0,8192)  //returns the first 8192 samples of left channel
  Samples = getSamplesFile(rafr,Channel,iPosition,iSizeFFT);
  rafr.close();
}
catch (IOException e) { System.out.println(e.toString()); }
Applying Window Function
Now I'm trying to apply Window function to Samples, check the code below
//double[] getWindow(8192,"hamming"); //was verified against matlab
Samples = applyFilter(Samples,getWindow(iSizeFFT,sWindow));
Trying to Normalize
Get the Log10 of of absolute value of each complex item of array of FFT, later multiply by 20
//fft:  Returns a complex array with FFT (the result was tested and it is equal to Matlab)
//getArrayComplexMod: Returns a double array with absolute value of each complex number
//getRealArrayLog10: Returns a double array with Math.log of each double element
//getRealArrayScalarMult: Returns a double array multiplying each double element with 20.0

Samples = getRealArrayScalarMult(getRealArrayLog10(getArrayComplexMod(fft(Samples))),20.0);
Obtain the Frequency in Hertz
//Now the freq or bins
double[] bins = new double[iSizeFFT];  //Size 8192
Integer SmplRt = 8000;
for (int i = 0; i < iSizeFFT; i++) {
  bins[i] = (double)i*SmplRt/iSizeFFT;
}
The code to apply filter (or Hamming window) to Samples.
http://en.wikipedia.org/wiki/Finite_impulse_response#Definition
  static double[] applyFilter(double[] dSamples, double[] dFilter) {
    return applyFilter(dSamples, dFilter, 0);
  }

  static double[] applyFilter(double[] dSamples, double[] dFilter, int PosSample) {
    double[] filteredSamples = new double[dSamples.length - PosSample];
    for (int i = PosSample; i < dSamples.length; i++) {
      filteredSamples[i - PosSample] = 0;
      for (int j = 0; j < dFilter.length; j++) {
        if(!((i - j) < 0)) {
          filteredSamples[i - PosSample] += dSamples[i-j]*dFilter[j];
        }
      }
    }
    return filteredSamples;
  }
EDIT 1: Following the answer of @hotpow2, solved!

