0
$\begingroup$

I was trying to understand convolution from this book and came across this figure:
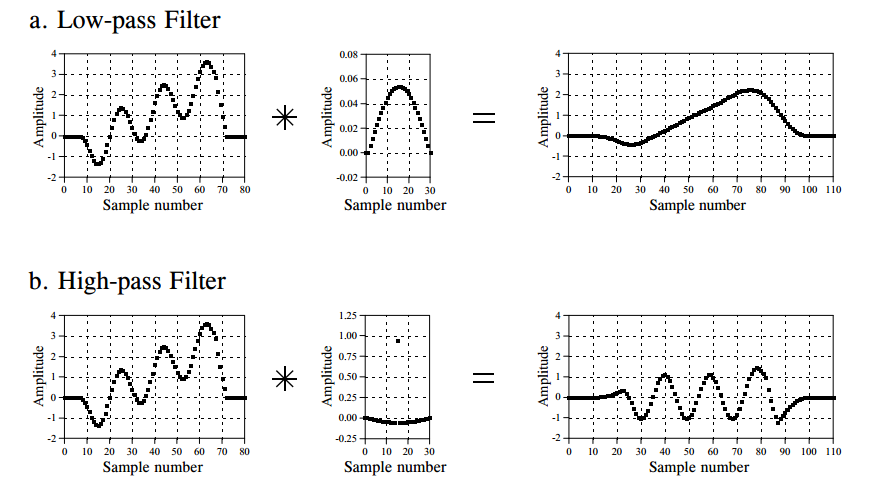
enter image description here

Here, the input signal is a combination of a sine wave and a ramp. In fig a, the input signal is convolved with a special type of impulse response that is said to be a 'low pass filter' and the output is just the ramp.

And in fig b, impulse response is actually a high pass filter and the output is just the sine wave.

What I'm trying to do is, just by looking at the wave-forms for the impulse response functions, trying to find an intuitive way of knowing what those impulse responses will do when convoluted with a given input signal. I can't 'see' how the first waveform will result only in the ramp as the output signal when given the mentioned input.

Can you guys figure this intuitively in your head? If so, then how?

$\endgroup$

2 Answers 2

1
$\begingroup$

Here's an idea...

In the first case, the impulse response has only positive coefficients. Groups of nearby samples will be averaged to yield the output signal. Thus, short term bumps/variations will be "averaged out", so the signal will be smoother. Furthermore, it looks like all coefficients sum up to 1 (there about 30 of them, in a triangle-like shape, the maximum is about 0.06, I suspect they sum to 1), so the overall amplitude / magnitude of the output waveform will be preserved. Last bit of information: the impulse response has its center of gravity at $n=15$, so the output signal will be delayed by 15 samples.

The second impulse response looks like a kronecker delta (at $n=15$) minus the impulse response from the previous example. Because convolution is a linear operation, the result will be the original signal shifted by 15 samples, minus the smoothed signal obtained in the previous example. In other words, the result will be whatever has been smoothed out in the previous example because of averaging - only the fast wiggles will remain.

Summing the output signals from example 1 and example 2 will yield the input signal delayed by 15 samples.

$\endgroup$
0
$\begingroup$

I suggest that you switch books. I just scanned your reference and I'm not enthusiastic. (The code is in BASIC, how vintage).

For starters, visit the MIT Open Course Ware 6.003 page.

In terms of texts, I recommend:

  1. Circuits, Signals, and Systems, William Siebert (undergraduate)
  2. Discrete-Time Signal Processing, Oppenheim and Schafer (graduate)

To answer your question: no I cannot intuitively figure out the results you show. There is too little information. However, with a clearly defined impulse response one can certainly intuit input / output relationships.

$\endgroup$
2
  • $\begingroup$ It did a pretty good job of explaining convolution though. Thanks for the links. $\endgroup$
    – rapturous
    Commented Nov 1, 2014 at 21:52
  • $\begingroup$ I don't think that it is as pedagogical as it could be. Check out the wikipedia page on convolution as well. $\endgroup$ Commented Nov 1, 2014 at 21:56

Your Answer

By clicking “Post Your Answer”, you agree to our terms of service and acknowledge you have read our privacy policy.

Not the answer you're looking for? Browse other questions tagged or ask your own question.