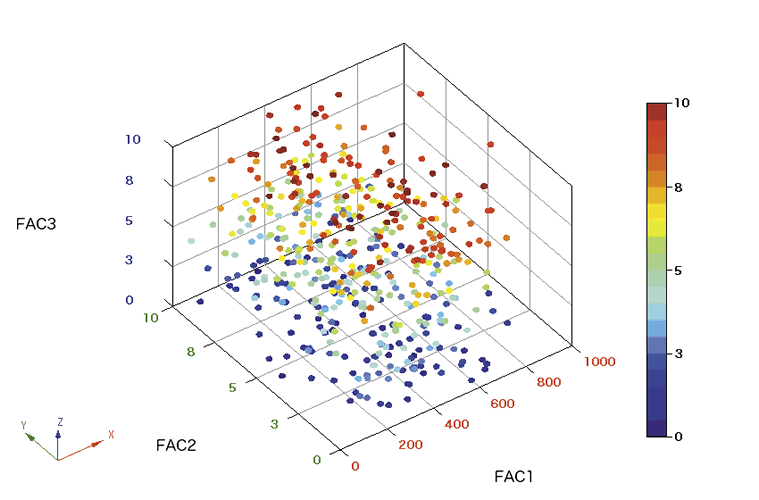
If I'm interpreting the question correctly, you're looking for a way to find a distribution of the frequencies in each images. It sounds like you might need some sort of 3D scatterplot.

If you have 20 images that are 256x256, how I imagine this working is,
- Take your 2D FFT or 2D DCT (or blockwise FFT/DCT) for each image
- Normalize all the values so you can have a good comparison between each image
- Concatenate all the frequency domain images into a 256 x 256 x 20 matrix
- Filter out the values that are below a certain threshold because they do not represent a significant component of your image. For example, if the magnitude of the values in the corners that represent high frequency information are very low, then removing them won't make a huge difference to your image because most of the information is elsewhere. But removing those data points create holes in your 3D plot so you can see the information that you're interested in
- Plot the data in 3D. If you're using Matlab, you can use scatter3(). The plot will be easier to read if you apply a heatmap.
Otherwise, if you're looking for the frequency information of a single image, there's several ways to represent the data depending on your problem. If you clarify the question you have and it's application, I can edit this answer.
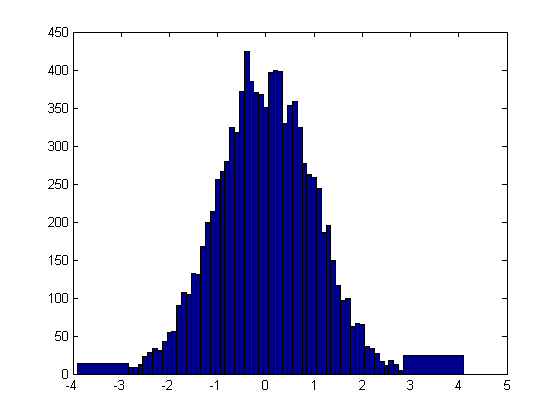
If you take the histogram of a grayscale image, you'll see a distribution of the intensity values of each pixel.
This easiest way to see this is to open up the image in a photo-editing software, like Photoshop, GIMP, Picasa and select histogram from the menu.
If you want to use Matlab, the hist() function plots a histogram similar to the one below. You can directly pass your image variable into the hist() function. But it's important to pick a good bin size, because different bin sizes can dramatically change the representation of the data. There are ways to calculate optimal bin sizes, but you can always guess and check.


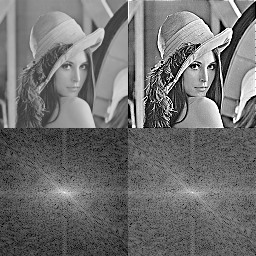
Follow the Wikipedia article for the theoretical explanation, but basically the 2D FFT gives you an image of the intensity of low frequency to high frequency information. The center of the image is low frequency information (such as flat surface, sky, skin, walls) and the corners are high frequency information (edges, grainy noise, intricate patterns).
If you're using Matlab, you need to shift the 2D FFT to put the low frequency information in the center of the image. It's also a good idea to normalize the 2D FFT so you can see the details better; it's similar to contrast enhancing a photograph to see the details.

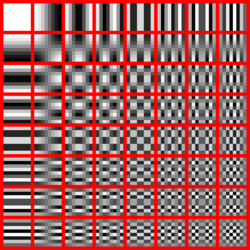
Follow the Wikipedia article for the theoretical explanation. The 2D DCT is very similar to the 2D FFT; It also gives you an image of the intensity of low frequency to high frequency information, but the low frequency information is in the top-left corner and the high frequency information is in the bottom-right corner. This makes the information easier to manipulate (at least for me).
Generally, the 2D DCT is used on blocks of an image (8x8 pixels). This gives you frequency information that is still related to its location in the spatial image.
The 2D DCT is useful for encoding images. A variant of JPEG encoding uses the 2D DCT transform.


