I am new to signal processing, so sorry if the question is superbanal. I have been spending more days than I would admit on this and can't find the error.
I have two triangle waves that are emitted from loudspeakers and M sensor in a linear uniform array. I need to estimate the delays of the single wave in the single sensor.
I went through the math and understand I have to use the correlation, but when I implement it in Matlab I clearly do some mistakes and get a correlation that has only one peak, in the center (in time) of the signal.
I don't think I can add pictures because I have no reputation on this SO, I hope the question is clear.
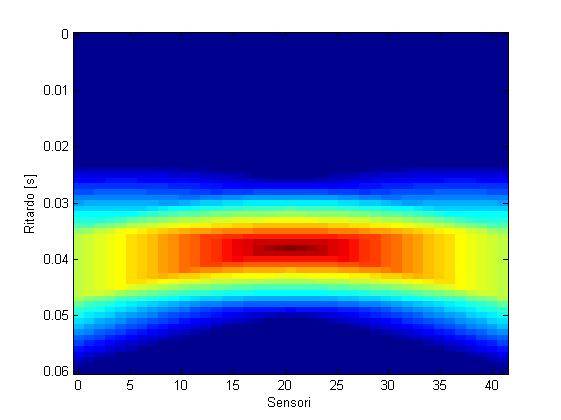
EDIT: Apparently I can, so this is the delay per sensor  .
.
In Matlab I basicly do xcorr(X(:,sensor),temp), where X(:,sensor) is the signal received in a sensor, that is the signal received from the two sources plus a small gaussian error and temp is the triangle signal emitted by both sources.
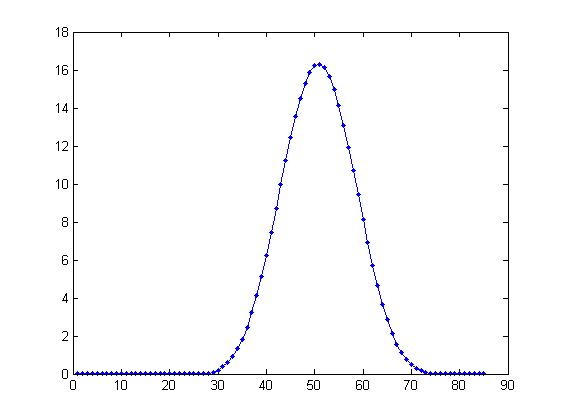
Why does the crosscorrelation have only one peak and not two?
EDIT: full code
clear all
clc
% close all
%dati
v=350;%metri/sec
xa=1; %metri
ya=8;
xb=9;
yb=8;
spazio=0.25;%spazio intra sensori
spt=12.5*10^-3;%secondi
M=41;

%ipotesi
sig=1/10;


%distanze trasmettitore/microfoni
indic_min_dista=xa/spazio+1;%5
indic_min_distb=xb/spazio+1;%37

da=zeros(M,1); %vettore delle distanze
for i=(indic_min_dista):M
    da(i)=sqrt(ya^2+(spazio*(i-indic_min_dista))^2);
end

for i=1:(indic_min_dista -1)
    da(i)=sqrt(ya^2+(spazio*(indic_min_dista-i))^2);
end

db=zeros(M,1); %vettore delle distanze
for i=(indic_min_distb):M
    db(i)=sqrt(yb^2+(spazio*(i-indic_min_distb))^2);
end

for i=1:(indic_min_distb -1)
    db(i)=sqrt(yb^2+(spazio*(indic_min_distb-i))^2);
end
%tempo trasmettitore/microfoni

ta=zeros(M,1); %vettore dei tempi
for i=1:M
    ta(i)=da(i)/v;
end

tb=zeros(M,1); %vettore dei tempi
for i=1:M
    tb(i)=db(i)/v;
end
% ta-(fliplr(tb'))'==0 i tempi sono = se letti dagli estremi opposti
%vettore dei tempi di campionamento

win=10^-3;%secondi
N=ceil((max(ta)+2*spt)/win)+1;
% N=ceil((max(tb)+2*spt)/win)+1; sono = la situazione è del ttt simmetrica

samples=zeros(N,1);
for i=0:(N-1)
    samples(i+1)=-spt + win*(i);
end
rit=+spt+samples;

%segnale inviato
S=zeros(N,M);
temp=zeros(N,1);
for i =0:(N-1)
    for j=1:M


        if((samples(i+1)>ta(j)-spt) && (samples(i+1)<=ta(j)))
            S(i+1,j)=S(i+1,j)+1-abs(samples(i+1)-ta(j))/spt;
            if(j==1)
            temp(i+1)=+1-abs(samples(i+1)-ta(j))/spt;
            end
        end

        if((samples(i+1)>tb(j)-spt) && (samples(i+1)<=tb(j)))
            S(i+1,j)=S(i+1,j)+1-abs(samples(i+1)-tb(j))/spt;
        end

        if((samples(i+1)>ta(j)) && (samples(i+1)<=ta(j)+spt))
            S(i+1,j)=S(i+1,j)+1-abs(samples(i+1)-ta(j))/spt;
            if(j==1)
            temp(i+1)=+1-abs(samples(i+1)-ta(j))/spt;
            end
        end

        if((samples(i+1)>tb(j)) && (samples(i+1)<=tb(j)+spt))
            S(i+1,j)=S(i+1,j)+1-abs(samples(i+1)-tb(j))/spt;
        end
    end
end

figure
imagesc(0:41,rit,S)
xlabel('Sensori');%\sigma^2_\omega
ylabel('Ritardo [s]');


W=zeros(N,M);


%costruisco W
for i =1:N
    for j=1:M
        W(i,j)=normrnd(0,sig);
    end
end


X=W+S;

%vettore che uso per calcolo correlazioni
vv=find(temp~=0);
temp=temp(min(vv): max(vv));


%%
figure
imagesc(0:41,rit,X)
xlabel('Sensori');%\sigma^2_\omega
ylabel('Ritardo [s]');
figure
surf(S)
set(gca,'xlim',[0 41])
xlabel('Sensori'), ylabel('Ritardo [s]');

% ticklabels = get(gca,'YTickLabel');
newTicklabels = rit;%[ticklabels(2:end,:);'60'];
set(gca,'YTickLabel',newTicklabels);

figure
surf(X)
xlabel('Sensori'), ylabel('Ritardo [s]');

% ticklabels = get(gca,'YTickLabel');
newTicklabels = rit;%[ticklabels(2:end,:);'60'];
set(gca,'YTickLabel',newTicklabels);
set(gca,'xlim',[0 41])
set(gca,'zlim',[0 2])

%%
clc
% close all
% Stima ritardo per ogni sensore, in funzione di sigma^2
% valuta MSE cfr CRB almeno m=10 e y=5m,

sig=1/100;%[1/10 1/5 1/2];
Nrun=100;
%segnale vero S(:,41)
%segnale registrato X(:,41)
MSEA=zeros(M,length(sig));
MSEB=zeros(M,length(sig));
mediaA=zeros(M,length(sig));
mediaB=zeros(M,length(sig));

W=zeros(N,M);
psi=(-N:N)*win;%mi serve per valutare phi nella differenza tra i tau

for nrun=1:Nrun
        ia =zeros(length(sig),M); %indici del massimo della funzione di correlazione
        ib =zeros(length(sig),M); %indici del massimo della funzione di correlazione
        for k=1:length(sig)
            %costruisco W
            for i =1:N
                for j=1:M
                    W(i,j)=normrnd(0,sig(k));
                end
            end
            X=W+S;
            for sensor=41:41
                phisx=zeros(N+1,1);
                phiss=zeros(length(psi),1);%N*2+1
                    corrtemp=xcorr(X(:,sensor),temp);
                    figure
                    plot(corrtemp)
            end
        end
end
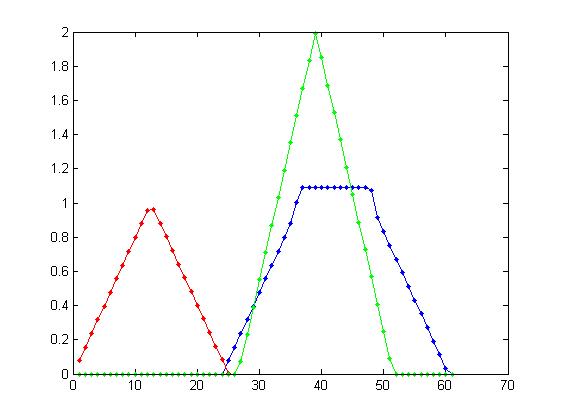
EDIT comparison of the received signal in two sensor (one on the side the blue one) and the central one (green line), the red line corresponds to the original triangle wave.

EDIT Correlation between triangle wave and received signal

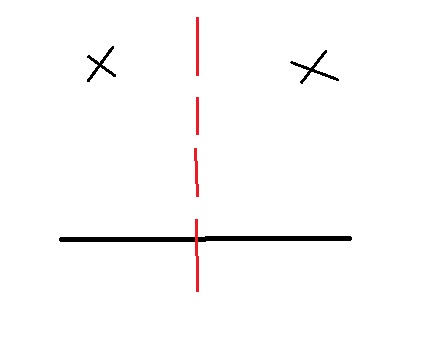
In response to the question, this is the hardware positioning. Please remember I am not an art major :D

